This chapter provides detailed descriptions of the Performance Analyzer toolset, including:
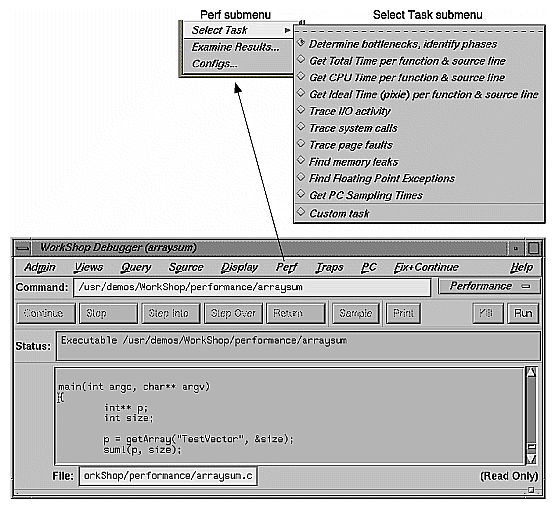
You choose performance tasks from the Select Task submenu in the Perf menu in Main View (see Figure 4-1). You should have an objective in mind before you start an experiment. The tasks ensure that only the appropriate data collection is enabled. Selecting too much data can bog down the experiment and skew the data for collection.
The tasks are summarized in Table 4-1. The Task column identifies the task as it appears in the Performance Task menu in the Performance Panel window. The Clues column provides an indication of symptoms and situations appropriate for the task. The Data Collected column indicates performance data set by the task. Note that call stacks are collected automatically at sample points, pollpoints, and process events. The Description column describes the technique used.
Table 4-1. Summary of Performance Analyzer Tasks
Task | Clues | Data Collected | Description |
|---|---|---|---|
Determine bottlenecks, identify phases | Slow program, nothing else known | Pollpoint Sampling (1 sec.) | Captures resource usage at the pollpoint sample and displays it in resource usage graphs. Minimal intrusion. Tracks the total time spent by function, source code line, and instruction. |
Get Total Time per function & source line | Not CPU-bound | Fine-Grained Usage (1 sec.) | Tracks the total time spent by function, source code line, and instruction. Useful for non-CPU-bound conditions. Total time metrics are displayed. |
Get CPU Time per function & source line | CPU-bound | Function Counts | Tracks CPU time spent in functions, source code lines, and instructions. Useful for CPU-bound conditions. CPU time metrics help you separate CPU-bound from non-CPU-bound instructions. |
Get Ideal Time (pixie) per function & source line | CPU-bound | Basic Block Counts | Calculates the ideal time, that is, the time spent in each basic block with the assumption of one instruction per machine cycle. Useful for CPU-bound conditions. Ideal time metrics also give counts, total machine instructions, and loads/stores/floating point instructions. It is useful to compare ideal time with the CPU time in an "Identify high CPU time functions" experiment. |
Trace I/O activity | Process blocking due to I/O. | I/O System call Trace | Captures call stacks at every read and write. The file description and number of bytes are available in I/O View. |
Trace system calls | Resource usage chart shows high system calls. | System call Trace | Records all system calls and corresponding call stacks. Gives system call counts for the functions, source code lines, and instructions making the system call. Also provides a stripchart showing the chronological sequence of system calls. |
Trace page faults | "Noisy disk" due to accesses | Page Fault Trace | Captures all page faults and corresponding call stacks. Produces event chart showing the page fault pattern. Lists page faults caused by function, source code line, and instruction. |
Find memory leaks | Swelling in process size | Malloc/Free Trace | Determines memory leaks by capturing the call stack, address, and size at all mallocs, reallocs, and frees and displays them in a memory map. Also indicates double frees. |
Find Floating Point Exceptions | High sys time in usage charts; presence of floating point operations; NaNs | FPE Exception Trace | Useful when you suspect that time is being wasted in floating point exception handlers. Captures the call stack at each floating point exception. Lists floating point exceptions by function, source code line, and instruction. |
Custom task |
| call stacks at sample points | Lets you select the performance data to be collected. Remember that too much data can skew results. |
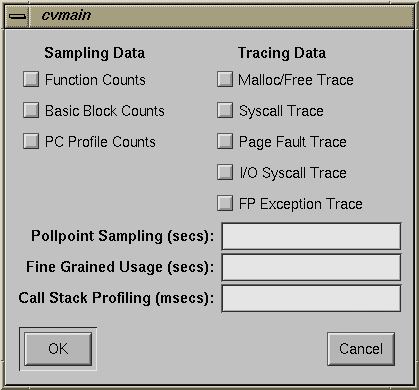
When you choose "Custom Task" from the Select Task submenu in the Perf menu in Main View, the dialog box shown in Figure 4-2 appears. This section provides an explanation of the performance data.
Sampling data is collected and recorded at every sample point. The collection of sampling data requires instrumentation, that is, adding special code to the target executable. You can request four kinds of sampling data:
call stack
function counts
basic block counts
PC profile counts
The Performance Analyzer performs call stack data collection automatically, capturing data at every sample point, pollpoint, and process event. There is no instrumentation involved.
Function count collection provides this information:
execution count of each function
execution count of each call site
This data is a subset of the information provided by basic block counts. However, gathering function count data does not slow down the instrumented executable as much as gathering basic block data.
 | Note: It is not possible to collect function count data simultaneously with call stack profiling data. |
In addition to the data provided by function counts, basic block counting provides you with the execution count of each line of machine code.
Basic block counts are translated to ideal CPU time displayed at the function, source line and machine line levels. The assumption made in calculating ideal CPU time is that each instruction takes exactly one cycle, and ignores potential floating point interlocks and memory latency time (cache misses and memory bus contention). Each system call is also assumed to take one cycle. The end result might be better described as ideal user CPU time.
The data is gathered by first instrumenting the target executable. This involves dividing the executable into basic blocks consisting of sets of machine instructions that do not contain branches into or out of them. A few lines of code are inserted for every basic block to increment a counter every time that basic block is executed. The basic block data is actually generated, and when the instrumented target executable is run, the data is written out to disk whenever a sample trap fires. Instrumenting an executable increases its size by a factor of three, and greatly modifies its behavior.
 | Caution: Running the instrumented executable causes it to run slower. By instrumenting, you might be changing the crucial resources; during analysis, the instrumented executable might appear to be CPU-bound, whereas the original executable was I/O-bound. |
 | Note: It is not possible to collect basic block count data simultaneously with call stack profiling data. |
Enabling PC profile counts causes the Program Counter (PC) of the target executable to be sampled every 10 ms when it is in the CPU. PC profiling is a lightweight, high-speed operation done with kernel support. Every 10 ms, the kernel stops the process if it is in the CPU, increments a counter for the current value of the PC, and resumes the process.
PC Profile Counts is translated to the Actual CPU Time displayed at the function, source line and machine line levels. The actual CPU time is calculated by multiplying the PC hit count by 10 ms.
A major discrepancy between actual CPU time and ideal CPU Time indicates:
cache misses and floating point interlocks in a single process application
secondary cache invalidations in a multiprocess application run on a multiprocessor
 | Note: This comparison is inaccurate over a single run if you collect both basic block and PC profile counts simultaneously. In this situation, the Ideal CPU Time will factor out the interference caused by instrumenting; the Actual CPU Time will not. A rough approximation is to divide the Actual CPU Time by three. |
A comparison between basic block counts and PC profile counts is shown in Table 4-2.
Table 4-2. Basic Block Counts and PC Profile Counts Compared
Basic Block Counts | PC Profile Counts |
|---|---|
Used to compute ideal CPU time | Used to estimate actual CPU time |
Data collection by instrumenting | Data collection done with the kernel |
Slows program down by factor of three | Has minimal impact on program speed |
Generates an exact count | Approximates counts |
Tracing data records the time at which an event of the selected type occurred. There are five types of tracing data:
 | Note: These features should be used with care; enabling tracing data adds substantial overhead to the target execution and consumes a great deal of disk space. |
Malloc/free tracing enables you to study your program's use of dynamic storage and to quickly detect memory leaks (mallocs without corresponding frees) and bad frees (freeing a previously freed pointer). For this kind of tracing, you must create the target executable by linking with -lmalloc_cv instead of the usual -lmalloc. This data can be analyzed in Malloc Error View, Leak View, Malloc View, and Heap View (see "Analyzing Memory Problems").
Note that linking with -lmalloc_cv is not compatible with MP analysis so that using -lmpc -lmalloc_cv will not work.
Enabling system call tracing causes the call stack to be recorded whenever your program makes a system call. This data can be viewed in the system call event chart in Usage View (Graphs) which indicates where the system calls took place and in the Call Stack window which displays the call stack for a selected system call.
Enabling page fault tracing causes the call stack and the faulting address to be recorded every time your program makes a memory reference that causes a page fault.
The Page Fault event chart displays where the page faults took place in Process View. The Call Stack Information window displays the call stack for a selected page fault event.
I/O syscall tracing records every I/O-related system call that is made during the experiment. It traces read and write system calls with the call stack at the time, along with the number of bytes read or written. This is useful for I/O-bound processes.
Floating point exception tracing records every instance of a floating point exception. This includes problems like underflow and NaN (not a number) values. If your program has a substantial number of floating point exceptions, you may be able to speed it up by correcting the algorithms.
 | Note: To use the floating point exception feature, you have to link your program with the library libfpe.a. |
The floating point exceptions are:
overflow
underflow
divide-by-zero
inexact result
invalid operand, e.g., infinity
There are three categories of polling data:
Entering a positive nonzero value in their fields turns them on and sets the time interval at which they will record.
Setting pollpoint sampling enables you to specify a regular time interval for capturing performance data, including resource usage and any enabled sampling or tracing functions. Since pollpoint sampling occurs frequently, it is best used with call stack data only rather than other profiling data. Its primary utility is to enable you to identify boundary points for phases. In subsequent runs, you can set sample points to collect the profiling data at the phase boundaries.
Resource usage data is always collected at each sample point. Setting a time in the Fine Grained Usage field records resource usage data more frequently, at the specified time intervals. Fine grained usage helps you see fluctuations in usage between sample points.
You can analyze resource usage trends in the charts in Usage View (Graphs) and can view the numerical values in the Usage View (Numerical).
Fine grained usage has little effect on the execution of the target process during data collection. It is of limited use if the program is divided into phases of uniform behavior by the placement of the sample points.
Enabling call stack profiling causes the call stack of the target executable to be sampled at the specified time interval (minimum of 10 ms) and saved. The call stack continues to be sampled when the program is not running, while it is internally or externally blocked. Call stack profiling is used in the "Identify high total time functions" task to calculate total times.
Call stack profiling is accomplished by the Performance Analyzer views and not by the kernel. As a result, it is less accurate than PC profiling. Collecting call stack profiling data is far more intrusive than collecting PC profile data.
 | Caution: Collecting basic block data causes the text of the executable to be modified. Therefore, if call stack profiling data is collected along with basic block counts, the cumulative total time displayed in Usage View (Graphs) is potentially erroneous. |
Table 4-3 compares call stack profiling and PC profiling.
Table 4-3. Call Stack Profiling and PC Profiling Compared
PC Profiling | Call Stack Profiling |
|---|---|
Done by kernel | Done by Performance Analyzer process |
Accurate, non-intrusive | Less accurate, more intrusive |
Used to compute CPU time | Used to compute total time |
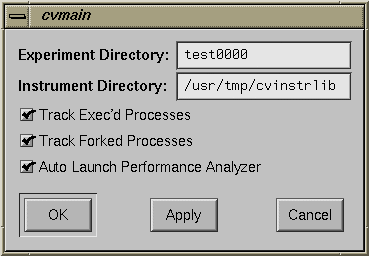
To specify the experiment configuration, you choose "Configs..." from the Perf menu. This displays the dialog box shown in Figure 4-3.
The Experiment Directory field lets you specify the directory where the data captured during the next experiment is stored. The Performance Analyzer provides a default directory named test0000. If you use the default or any other name that ends in four digits, the four digits are used as a counter and will be incremented automatically for each subsequent experiment. Note that the Performance Analyzer does not remove (or overwrite) experiment directories. You need to remove directories yourself.
The Instrument Directory lets re-use a previously instrumented executable. This technique avoids the processing necessary for a new instrumentation. Often in a series of experiments, you collect the same type of data while stressing the target executable in different ways. Reusing the instrumented executable lets you do this conveniently.
To reuse an executable from a previous experiment, simply enter the old experiment directory.
The Track Exec'd Processes toggle allows you to specify whether or not you want the Performance Analyzer to gather performance data for any programs that are launched by an exec in any of the target processes. If this feature is enabled and there are execs in the course of the experiment, then you can view the performance data for any of these other executables by using the Executable menu in the Performance Analyzer main window. The Track Forked Processes toggle acts analogously for forked processes.
The Auto Launch Performance Analyzer toggle provides the convenience of launching the Performance Analyzer automatically when an experiment finishes.
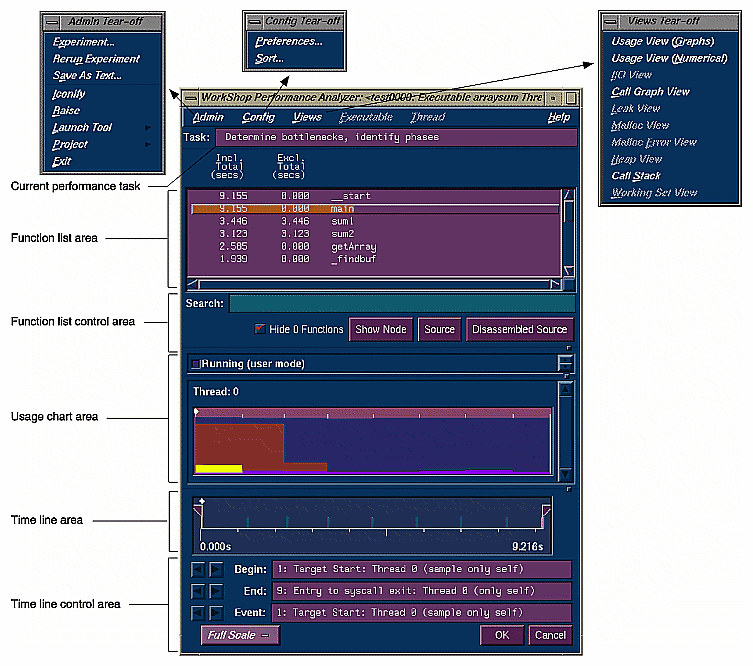
The Performance Analyzer main window is used for analysis after the performance data has been captured (see Figure 4-4). It contains a time line area indicating when events took place over the span of the experiment, a list of functions with their performance data, and a resource usage chart. This section covers these topics:
The Performance Analyzer main window can be invoked from the "Launch Tool" submenu in the Debugger Admin menu or from the command line, by typing:
cvperf -exp experimentdirectory |
where experimentdirectory is the directory containing the performance data from the experiment.
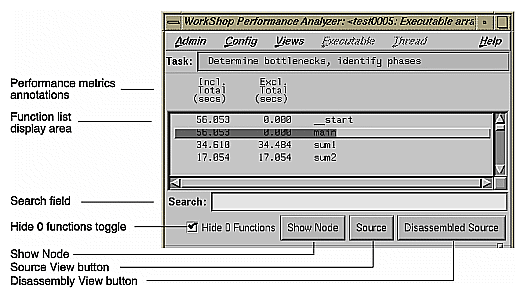
The Task field identifies the task for the current experiment and is read-only. See "Selecting Performance Tasks" for a summary of the performance tasks. For an in-depth explanation of each task, refer to Chapter 3, "Setting Up Performance Analysis Experiments."
The function list area displays the program's functions with the associated performance metrics. It also provides buttons for displaying function performance data in other views. See Figure 4-5.
The main features of the function list are:
The usage chart area in the Performance Analyzer main window (see Figure 4-4) displays the stripchart most relevant to the current task. The upper subwindow displays the legend for the stripchart and the lower subwindow displays the stripchart itself. This lets you obtain some useful information without having to open the Usage View (Graphs) window. Table 4-4 shows you the data displayed in the usage chart area for each task.
Table 4-4. Task Display in Usage Chart Area
Task | Data in Usage Chart Area |
|---|---|
Determine bottlenecks, identify phases | User versus system time |
Get total time per function & source line | User versus system time |
Get CPU time per function & source line | User versus system time |
Get ideal time per function & source line | User versus system time |
Trace I/O activity | read(), write() system calls |
Trace system calls | System call event chart |
Trace page faults | Page fault event chart |
Find memory leaks | Process Size stripchart |
Find floating point exceptions | Floating point exception event chart |
Custom task | User versus system time unless
tracing data has been selected |
The time line shows when each sample event in the experiment occurred. Figure 4-6 shows the time line portion of the Performance Analyzer window with typical results.
The calipers let you define an interval for performance analysis. You can set the calipers in the time line to any two sample event points, using the caliper controls or by dragging them directly. The calipers appear solid for the current interval. If you drag them with the mouse (left or middle button), they appear dashed to give you visual feedback. When you stop dragging a caliper, it appears in outlined form denoting a tentative and as yet unconfirmed selection.
Specifying an interval is done as follows:
Set the left caliper to the sample event at the beginning of the interval.
You can drag the left caliper with the left or middle mouse button or by using the left caliper control buttons in the control area. Note that calipers always snap to sample events. (Note that it actually doesn't matter whether you start with the left or right caliper.)
Set the right caliper to the sample event at the end of the interval.
This is similar to setting the left caliper.
Confirm the change by clicking the OK button in the control area.
After you confirm the new position, the solid calipers move to the current position of the outlined calipers and change the data in all views to reflect the new interval.
Clicking Cancel or clicking with the right mouse button before the change is confirmed restores the outlined calipers to the solid calipers.
If you want to get more information on an event in the time line or in the charts in Usage View (Graphs), you can click an event with the left button. The Event field (see Figure 4-6) displays
event number
description of the trap that triggered the event
the thread in which it was defined
whether the sample was taken in all threads or the indicated thread only, in parentheses
In addition, the Call Stack View window updates to the appropriate times, stack frames, and event type for the selected event. A black diamond-shaped icon appears in the time line and charts to indicate the selected event. You can also select an event using the event controls below the caliper controls; they work in similar fashion to the caliper controls.
The scale menu lets you change the number of seconds of the experiment displayed in the time line area. The "Full Scale" selection displays the entire experiment on the time line. The other selections are time values; for example, if you select "1 min", the length of the time line displayed will span 1 minute.
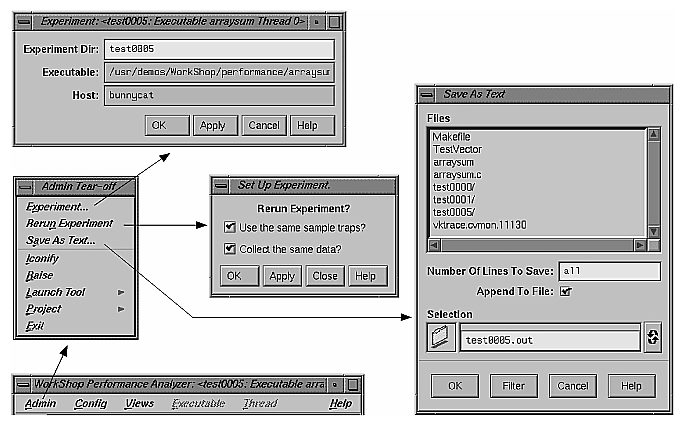
The Admin menu and its options are shown in Figure 4-7. The Admin menu has selections common to the other WorkShop tools. There are three selections different in the Performance Analyzer:
| "Experiment..." |
| |
| "Rerun Experiment" |
| |
| "Save As Text..." |
|
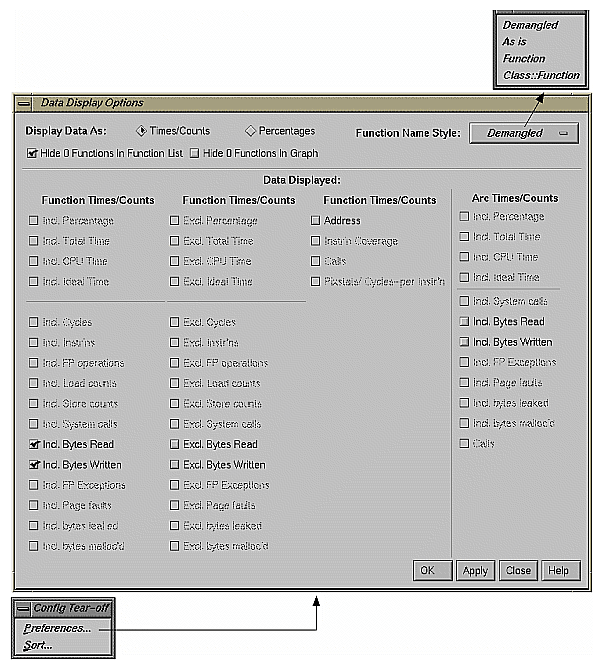
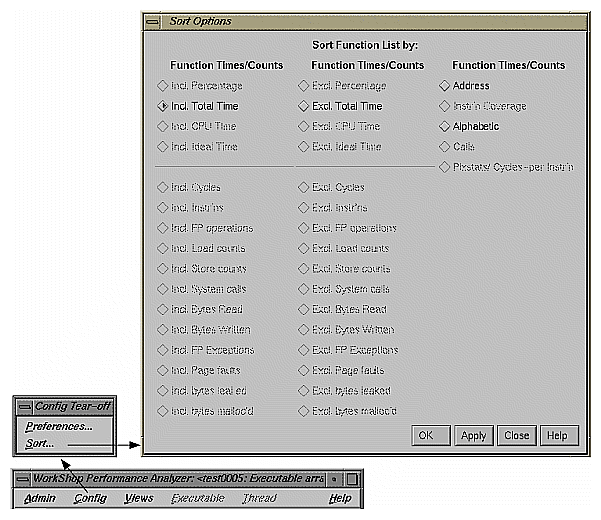
The main purpose of the Config menu in the Performance Analyzer main window is to let you select the performance metrics for display and for ranking the functions in the Function List.
The selections in the Config menu are:
| "Preferences..." |
See Figure 4-8. | |
| "Sort..." |
See Figure 4-8. |
The performance data selections are the same for both the Preferences and Sort dialog boxes. The difference between the inclusive (Incl.) and exclusive (Excl.) metrics is that inclusive data includes a function's calls and exclusive data does not.
The toggles in the Data Display Options and Sort Options are:
| Address |
| |
| Calls |
| |
| Incl. Total Time, Excl. Total Time |
| |
| Incl. CPU Time, Excl. CPU Time |
| |
| Incl. Ideal Time, Excl. Ideal Time |
| |
| Incl. Malloc counts, Excl. Malloc counts |
| |
| Incl. System calls, Excl. System calls |
| |
| Incl. Page faults, Excl. Page faults |
| |
| Incl. FP operations, Excl. FP operations |
| |
| Incl. Load counts, Excl. Load counts |
| |
| Incl. Store counts, Excl. Store counts |
| |
| Incl. Bytes Read, Excl. Bytes Read |
| |
| Incl. Bytes Written, Excl. Bytes Written |
| |
| Incl. FP Exceptions, Excl. FP Exceptions |
| |
| Incl. Instructions, Excl. Instructions |
|
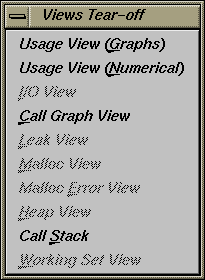
The Views menu in Performance Analyzer (see Figure 4-10) provides these selections for viewing the performance data from an experiment. Each view displays the data for the time interval bracketed by the calipers in the time line.
| "Usage View (Graphs)" |
| |
| "Usage View (Numerical)" |
| |
| "I/O View" |
| |
| "Call Graph View" |
| |
| "Leak View" |
| |
| "Malloc View" |
| |
| "Heap View" |
| |
| "Call Stack" |
|
If you enabled Track Exec'd Processes (in the Performance Panel) for the current experiment, the Executable menu will be enabled and will contain selections for any exec'd processes. These selections let you see the performance results for the other executables.
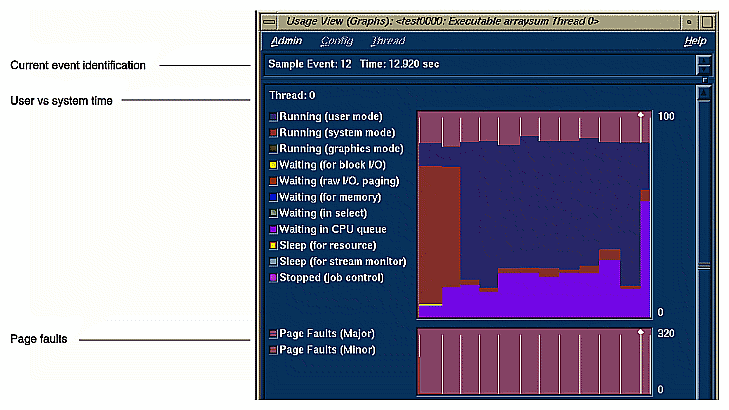
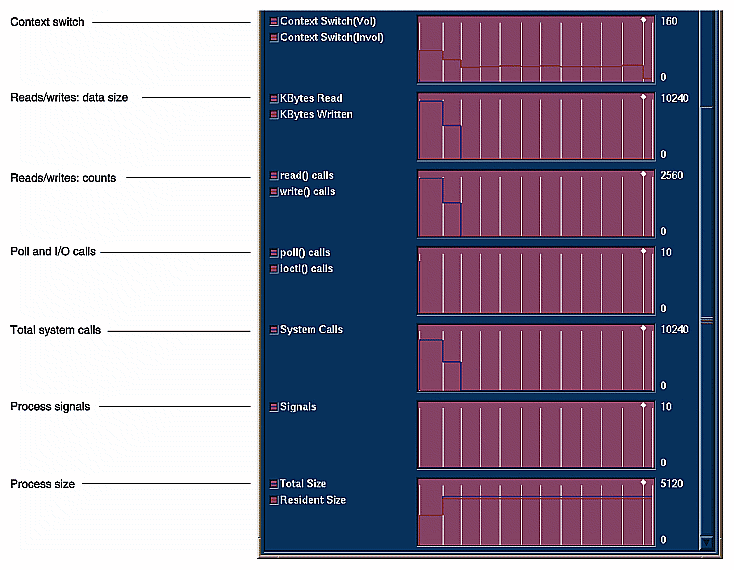
Usage View (Graphs) displays resource usage and event charts containing the performance data from the experiment. These charts show resource usage over time and indicate where sample events took place. Sample events are shown as vertical lines. Figure 4-11 shows the User vs system time and Page faults graphs; Figure 4-12 shows the other graphs.
The available charts are:
The charts indicate trends; to get detailed data, you click the relevant area on the chart and the data displays in the current event line. The left mouse button displays event data; the right displays interval data.
When you click the left mouse button on a sample event in a chart, the following actions take place:
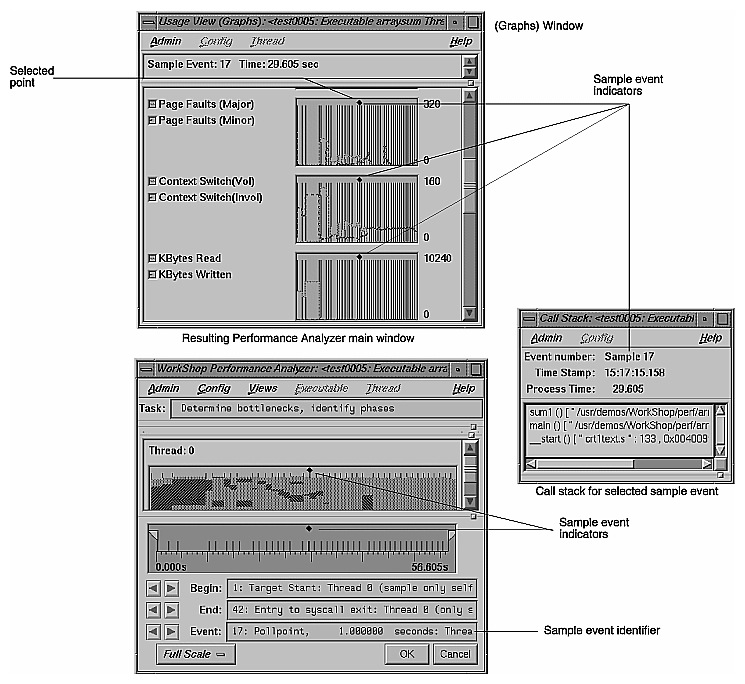
The point becomes selected, as indicated by the diamond marker above it. The marker appears in the time line, resource usage chart, and Usage View (Graphs) charts if the window is open.
The current event line identifies the event and displays its time.
The call stack corresponding to this sample point gets displayed in the Call Stack window (see "Call Stack").
Figure 4-13 illustrates the process of selecting a sample event.
Clicking a graph with the right button displays the values for the fine-grained interval (if collection was specified) or if not, the interval bracketed by the nearest sample events.
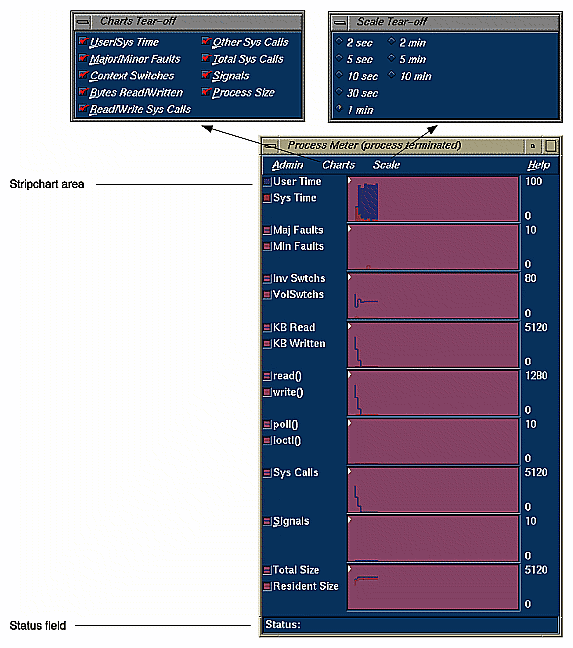
Process Meter lets you observe resource usage for a running process without conducting an experiment. To call Process Meter, select "Process Meter" from the Views menu in the Debugger Main View.
A Process Meter window with data and its menus displayed appears in Figure 4-14. Process Meter uses the same Admin menu as the WorkShop Debugger tools.
The Charts menu options display the selected stripcharts in the Process Meter.
The Scale menu adjusts the time scale in the stripchart display area such that the time selected becomes the end value.
You can select which usage charts and event charts display. You can also display sample point information in the Status field by clicking within the charts.
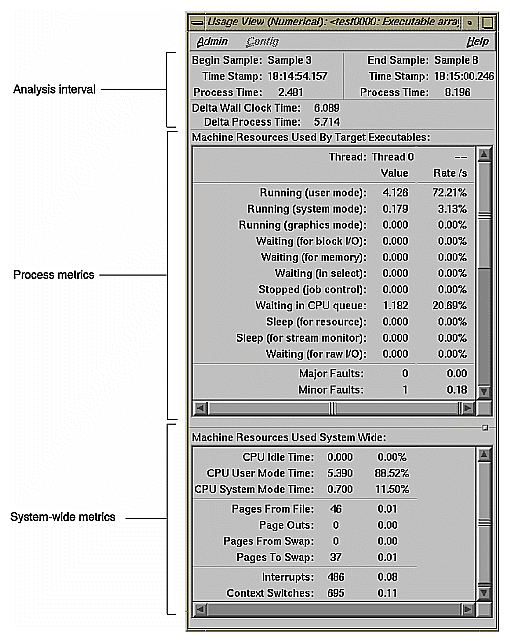
The Usage View (Numerical) window (see Figure 4-15) shows detailed, process-specific resource usage information in a textual format for the interval defined by the calipers in the time line area of the Performance Analyzer main window. To display the Usage View (Numerical) window, select "Usage View (Numerical)" from the Views menu.
The top of the window identifies the beginning and ending events for the interval. The middle portion of the window shows resource usage for the target executable. The bottom panel shows resource usage on a system-wide basis. Data is shown both as total values and as per-second rates.
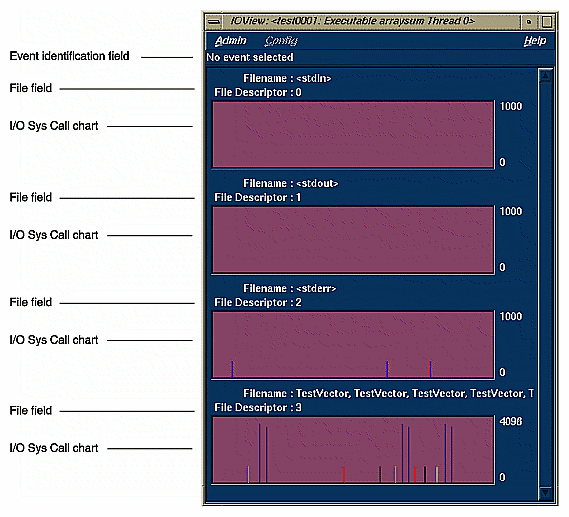
I/O View helps you determine the problems in an I/O-bound process. It produces graphs of all I/O system calls for up to 10 files involved in I/O. Clicking an I/O event with the left mouse button displays information about it in the event identification field at the top of the window. See Figure 4-16.
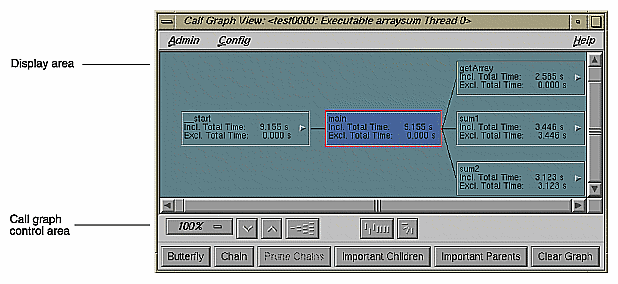
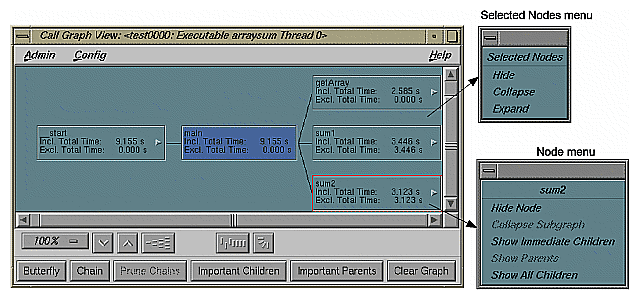
The Call Graph View window displays a call graph showing the functions as nodes and their calls as connecting arcs, both annotated with performance metrics (see Figure 4-17). You bring up Call Graph View by selecting "Call Graph View" from the Views menu.
Since a call graph can get quite complicated, Performance Analyzer provides various controls for changing the graph display. The "Preferences" selection in the Config menu lets you specify which performance metrics display and also lets you filter out unused functions and arcs. There are two node menus in the display area; these let you filter nodes individually or as a selected group. The top row of display controls is common to all ProDev WorkShop graph displays and let you change scale, alignment, and orientation, or see an overview (see Appendix A, "Using Graphical Views,") in the ProDev WorkShop Overview. The bottom row of controls lets you define the form of the graph: as a butterfly graph showing the functions that call and are called by a single function or as a chain graph between two functions.
Although rare, nodes can be annotated with two types of graphic symbols:
A right-pointing arrow in a node indicates an indirect call site. It represents a call through a function pointer. In such a case, the called function cannot be determined by the current methods.
A circle in a node indicates a call to a shared library with a data-space jump table. The node name is the name of the routine called, but the actual target in the shared library cannot be identified. The table might be switched at run time, directing calls to different routines.
You can specify which performance metrics appear in the call graph as follows.
To specify the performance metrics that display inside a node, you need the Preferences dialog box in the Config menu from the Performance Analyzer main view (see Figure 4-8).
Arc annotations are specified by selecting "Preferences..." from the Config menu in Call Graph View (see Figure 4-8). You can display the counts on the arcs. You can also display the percentage of calls to a function broken down by incoming arc. For an explanation of the performance metric items, refer to "Config Menu".
You can specify which nodes and arcs appear in the call graph as follows.
The Call Graph Display Options dialog box accessed from the "Preferences" selection in the Call Graph View Config menu also lets you hide functions and arcs that have 0 (zero) calls. See Figure 4-8.
There are two node menus for filtering nodes in the graph: the Node menu and the Selected Nodes menu. Both menus are shown in Figure 4-18.
The Node menu lets you filter a single node. It is displayed by holding the right mouse button down while the cursor is over the node. The name of the selected node appears at the top of the menu.
The Node menu selections are:
| "Hide Node" |
| |
| "Collapse Subgraph" |
| |
| "Show Immediate Children" |
| |
| "Show Parents" |
| |
| "Show All Children" |
|
The Selected Nodes menu lets you filter multiple nodes. You can select multiple nodes by dragging a selection rectangle around them. You can also Shift-click a node and it will be selected along with all the nodes that it calls. Holding down the right mouse button anywhere in the graph except over a node displays the Selected Nodes menu. The Selected Nodes menu selections are:
| "Hide" |
| |
| "Collapse" |
| |
| "Expand" |
|
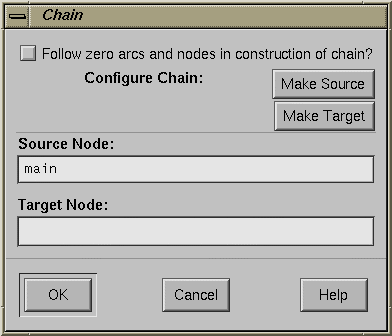
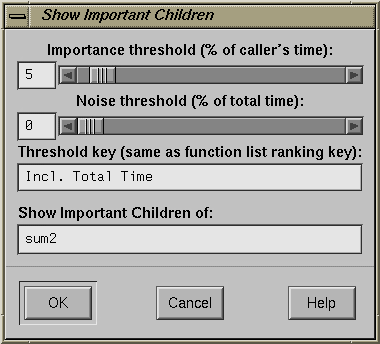
The lower row of controls in the panel helps you reduce the complexity of a busy call graph (see Figure 4-19).
You can perform these display operations:
| Butterfly |
| |
| Chain |
| |
| Prune Chains |
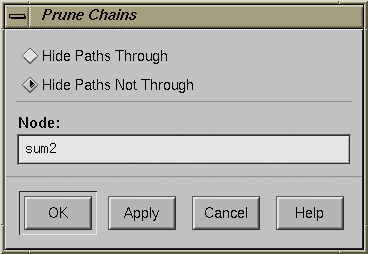
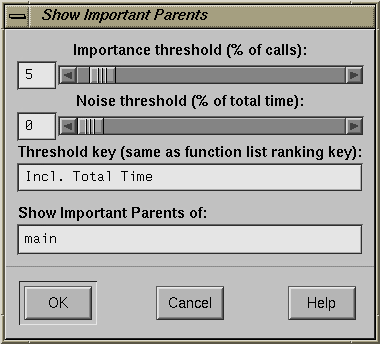
The Prune Chains button is only activated when a chain mode operation has been performed. The dialog box selections are:
| |
| Important Children |
| |
| Important Parents |
| |
| Clear Graph |
|
Call Graph View provides facilities for changing the display of the call graph without changing the data content.
The controls for changing the display of the call graph are in the upper row of the control panel (see Figure 4-24).
These facilities are:
For more information on the graphical controls, see Appendix A, "Using Graphical Views," in the ProDev WorkShop Overview.
You can move an individual node by dragging it using the middle mouse button. This helps reveal obscured arc annotations.
You can select multiple nodes by dragging a selection rectangle around them. You can also shift-click a node and it will be selected along with all the nodes that it calls.
The Performance Analyzer provides four tools for analyzing memory problems: Malloc Error View, Leak View, Malloc View, and Heap View. Setting up and running a memory analysis experiment is the same for all four tools. After you have conducted the experiment, you can apply any of these tools.
To look for memory leaks or bad frees, or perform other analysis of memory allocation, you need to run a Performance Analyzer experiment with "Find memory leaks" specified as the experiment task. You run a memory corruption experiment like any performance analysis experiment by clicking Run in the Debugger Main View. The Performance Analyzer keeps track of each malloc (memory allocation), realloc (reallocation of memory), and free. The general steps in running a memory experiment are:
Link your executable with one of the special WorkShop malloc libraries (-lmalloc_cv or -lmalloc_cv_d).

Note: For a detailed discussion of the malloc libraries, see "Compiling With the Malloc Library" in the ProDev WorkShop Debugger User's Guide. This tutorial assumes that library -lmalloc_cv is used. Before you even run a memory experiment, you need to relink your executable with the WorkShop malloc library (libmalloc_cv) instead of the malloc library (libmalloc). You can compile it from scratch as follows:
cc -g -o targetprogram targetprogram.c -lmalloc_cv
or you can relink it by using:
ld -o targetprogram targetprogram.o -lmalloc_cv
Display the Performance Panel.
You can bring up the Performance Panel by selecting "Performance Task..." from the Admin menu in the Debugger Main View or by typing cvspeed at the command line.
Specify "Find memory leaks" as the experiment task.
"Find memory leaks" is a selection on the Performance Task menu in the Performance Panel. It ensures that the appropriate performance data is collected. (For more information, see "Find memory leaks" on page 301).
Run the memory leak experiment.
You run experiments by clicking the Run button in the Debugger Main View window.
Display the Performance Analyzer.
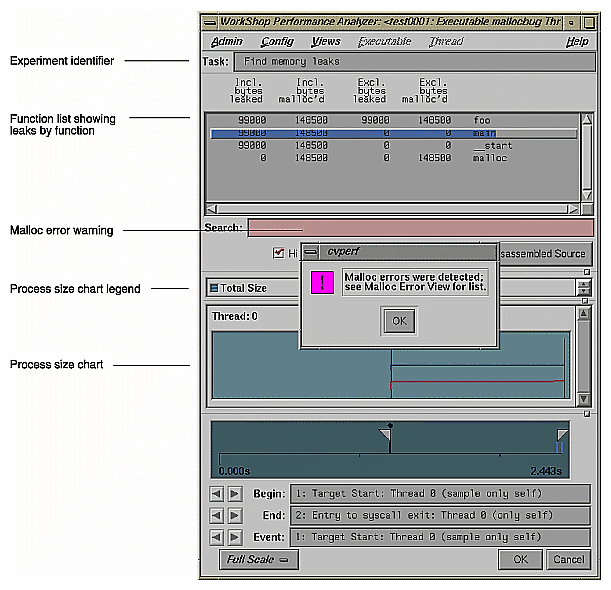
The Performance Analyzer displays results appropriate to the task selected, in this case, "Find memory leaks". Figure 4-25 shows the Performance Analyzer window after a memory experiment (after resizing). Note the dialog box that appears when memory problems are found.
Notice that the Function List displays inclusive and exclusive bytes leaked and malloced per function. Double-clicking a function brings up Source View displaying the function's source code annotated with bytes leaked and malloced. (To pinpoint the location of a memory problem more exactly, however, it is better to use Malloc Error View or Leak View and bring up Source View pointing to the exact location of the problem.) You can set other annotations in Source View and the Function List by choosing "Preferences..." from the Config menu in the Performance Analyzer and selecting the desired items.
The total process size chart displays in the usage chart portion of the window. Leakage and other memory problems cause a process's size to increase over time.
Analyze the results of the experiment in Leak View when doing leak detection and Malloc Error View when performing broader memory allocation analysis. To see all memory operations whether problems or not, use Malloc View. To view memory problems within the memory map, use Heap View. To look at the source code annotated with memory problems, bring up Source View from one of the other three tools.
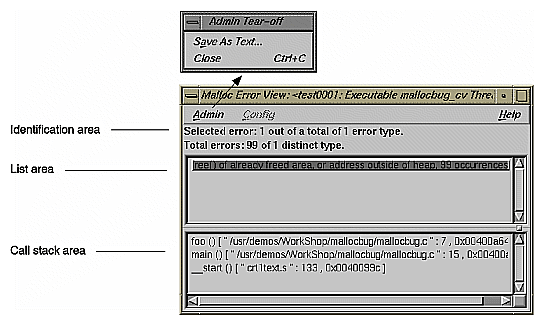
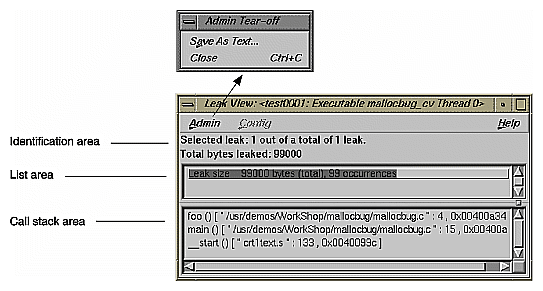
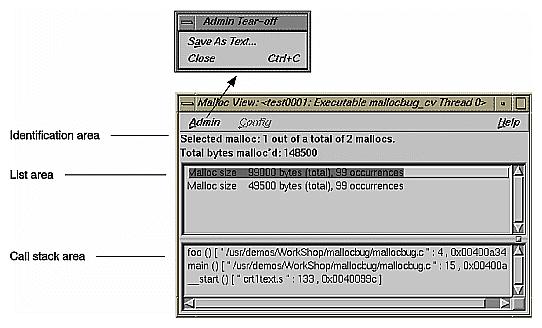
After you have run a memory experiment using the Performance Analyzer, you can analyze the results using Malloc Error View (see Figure 4-26), Leak View (see Figure 4-27), or Malloc View (see Figure 4-28). Malloc View is the most general showing all memory operations. Malloc Error View shows only those memory operations that caused problems, identifying the cause of the problem and how many times it occurred. Leak View displays each memory leak that occurs in your executable, its size, the number of times the leak occurred at that location during the experiment, and the corresponding call stack (when you select the leak).
Each of these views has three major areas:
identification area—This indicates which operation has been selected from the list. Malloc View identifies mallocs, indicating the number of malloc locations and the size of all malloc operations in bytes. Malloc Error View identifies leaks and bad frees, indicating the number of error locations, and how many errors occurred in total. Leak View identifies leaks, indicating the number of leak locations, and the total number of bytes leaked.
list area—This is a list of the appropriate types of memory operations according to the type of view. Clicking an item in the list identifies it at the top of the window and displays its call stack at the bottom of the list. The list displays in order of size.
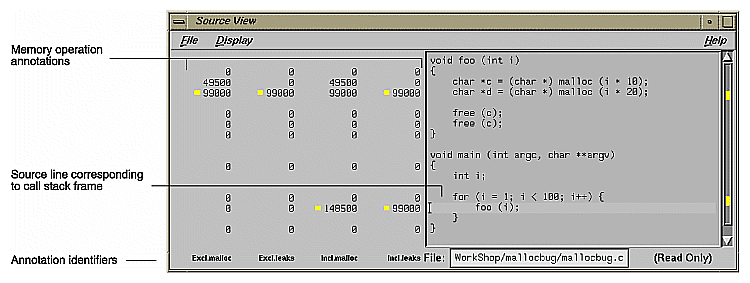
call stack area— This displays the contents of the call stack when the selected memory operation occurred. You can double-click a frame in the call stack to see the source code that caused the leak. Figure 4-29 shows a typical Source View window with leak annotations (you can change the annotations through the "Preferences..." selection in the Performance Analyzer Config menu). Notice that high counts display tagged.
 | Note: As an alternative to viewing leaks in Leak View, you can select one or more memory operations, choose "Save As Text..." from the Admin menu, and view them separately in a text file along with their call stacks. Multiple items are selected by clicking the first and then either dragging the cursor over the others or shift-clicking the last in the group to be selected. |
Heap View lets you analyze data from experiments based on the "Find Memory Leaks" task. The Heap View window provides a memory map that shows memory problems occurring in the time interval defined by the calipers in the Performance Analyzer window. The map indicates these memory block conditions:
malloc—reserved memory space
free—open space
realloc—reallocated space
bad free space
unused space
In addition to the Heap View memory map, you can analyze memory leak data using these other tools:
If you select a memory problem in the map and bring up the Call Stack window, it will show you where the selected problem took place and the state of the call stack at that time.
The function list in the Performance Analyzer main window shows inclusive mallocs and frees with bytes used by function for memory leak experiments.
The Source View window shows inclusive mallocs and frees and the number of bytes used by source line.
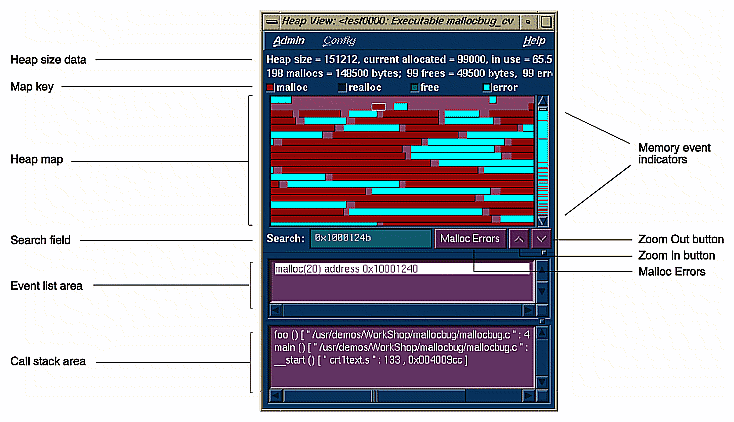
A typical Heap View window with its parts labeled appears in Figure 4-30.
The major features of a Heap View window are:
| Map key |
| |
| Heap View map area |
Note in Figure 4-30 that there are only a few problems in the memory at the lower addresses and many more at the higher addresses. | |
| Memory event indicators |
| |
| Search field |
If you enter a memory address in the field, the corresponding position will be highlighted in the heap map. If there was a problem at that location, it will be identified in the event list area. If there was no problem, the address at the beginning of the memory block and its size display. If you hold down the left mouse button and position the cursor in the heap map, the corresponding address will display in the Search field. | |
| Event list area |
| |
| Call stack area |
| |
| Malloc Errors button |
| |
| Zoom in button |
| |
| Zoom out button |
|
Like Malloc View, if you double-click a line in the call stack area of the Heap View window, the Source View window displays the portion of code containing the corresponding line, which is highlighted and indicated by a caret (^) with the number of bytes used by malloc in the annotation column. See Figure 4-29.
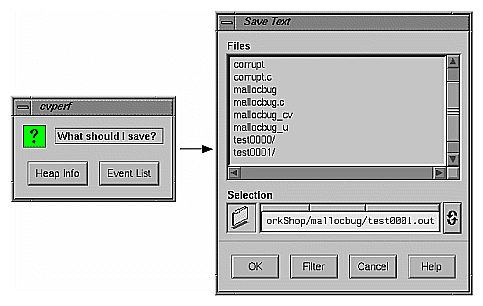
Selecting "Save As Text..." from the Admin menu in Heap View lets you save the heap information or the event list in a text file. When you first select "Save As Text...", a dialog box displays asking you to specify heap information or the event list. After you make your selection, the Save Text dialog box displays (see Figure 4-31). This lets you select the file name for saving the Heap View data. The default file name suggested is <experiment-directory>.out. When you click OK, the data for the current caliper setting and the list of unmatched frees, if any, is appended to the specified file.
 | Note: The "Save As Text..." selection in the File menu for the Source View from Heap View saves the current file. No filename default is provided, and the file that you name will be overwritten. |
In this tutorial, you will run an experiment to analyze memory usage. The short program below generates memory problems useful that demonstrate how you can use the Performance Analyzer to detect memory problems.
Go to the /usr/demos/WorkShop/mallocbug directory. Note the executable mallocbug_cv. This was compiled as follows:
cc -g -o mallocbug_cv mallocbug.c -lmalloc_cv -lc
Invoke the Debugger by typing
cvd mallocbug_cv
Bring up the Performance Panel by selecting "Performance Task..." from the Admin menu in Main View.
Select "Find memory leaks" from the Task menu and click the OK button. Then click Run to begin the experiment.
The program runs quickly and terminates.
Select "Performance Analyzer" from the "Launch Tool" submenu in the Debugger Admin menu.
The Performance Analyzer window appears. A dialog box indicating malloc errors displays also.
Select "Malloc View..." from the Performance Analyzer Views menu.
The Malloc View window displays, indicating two malloc locations.
Select "Malloc Error View..." from the Performance Analyzer Views menu.
The Malloc Error View window displays, showing one problem, a bad free, and its associated call stack. This problem occurred 99 times
Select "Leak View..." from the Performance Analyzer Views menu.
The Leak View window displays, showing one leak and its associated call stack. This leak occurred 99 times at 1,000 bytes each occurrence.
Double-click the function foo in the call stack area.
Source View displays showing the function's code, annotated by the exclusive and inclusive leaks.
Select "Heap View..." from the Performance Analyzer Views menu.
The Heap View window displays. The heap size and percentage used is shown at the top. The heap map area of the window shows the heap map as a continuous, wrapping horizontal rectangle. The rectangle is broken up into color-coded segments, according to memory use status.The color key at the top of the heap map area identifies memory usage as malloc, realloc, free, or bad free. Notice also that color-coded indicators showing mallocs, reallocs, and bad frees are displayed in the scroll bar trough. At the bottom of the heap map area are: the Search: field for identifying or finding memory locations; the Malloc Errors button for finding memory problems; a zoom-in control (upwards pointing arrow) and a zoom-out control (downwards arrow).
The event display area and the call stack are at the bottom of the window. Clicking any event in the heap area displays the appropriate information in these fields.
Click on any memory block in the heap map.
The beginning memory address appears in the Search: field. The event information displays in the event field. The call stack information for the last event appears in the call stack area.
Select other memory blocks to try out this feature.
As you select other blocks, the data at the bottom of the Heap View window changes.
Double-click on a frame in the call stack.
A Source View window comes up with the corresponding source code displayed.
Close the Source View.
Click the Malloc Errors button.
The data in the Heap View information window changes to display memory problems. Note that a free may be unmatched within the analysis interval, yet it may have a corresponding free outside of the interval.
Click Close to leave the Heap View information window.
Select "Exit" from the Admin menu in any open window to end the experiment.
This ends the tutorial.
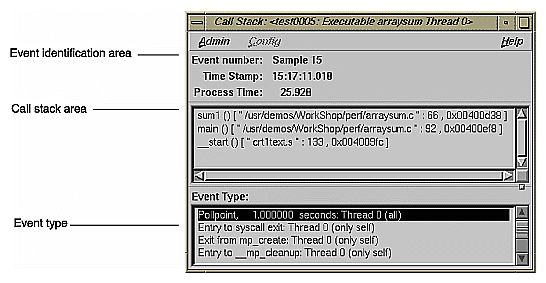
The Call Stack window accessed from the Performance Analyzer Views menu lets you get call stack information for a sample event selected from one of the Performance Analyzer views. See Figure 4-26.
There are three main areas in the window:
The event identification area displays the number of the event, its time stamp, and the time within the experiment. If you have a multi-process experiment, the thread will be indicated here.
The call stack area displays the contents of the call stack when the sample event took place.
The event type area highlights the type of event and shows the thread in which it was defined and whether the sample was taken in all threads or the indicated thread only, in parentheses.
If you suspect a problem with high page faulting or instruction cache misses, you should conduct working set analysis to determine if rearranging the order of your functions will improve performance. The term working set refers to those executable pages, functions, and instructions that are actually brought into memory during a phase or operation of the executable. If more pages are required than can fit in memory at the same time, then page thrashing, that is, swapping in and out of pages, may result slowing your program down. Strategic selection of which pages functions appear on can dramatically improve performance in such cases. You do this by creating a file containing a list of functions, their sizes, and addresses called a cord mapping file. The functions should be ordered so as to optimize page swapping efficiency. This file is then fed into the cord utility, which rearranges the functions according to the order suggested in the cord mapping file. See the reference (man) page for cord.
Working set analysis is appropriate for:
any program that runs for a long time
programs whose operation comes in distinct phases
distributed shared objects (DSOs) that are shared among several programs
WorkShop provides two tools to help you conduct working set analysis:
Working Set View is part of the Performance Analyzer. It displays the working set of pages for each DSO that you select and indicates the degree to which the pages are used.
The Cord Analyzer (cvcord) is separate from the Performance Analyzer and is invoked by typing cvcord at the command line. It displays a list of the working sets that make up a cord mapping file, shows their utilization efficiency, and most importantly, can compute an optimized ordering to reduce working sets.
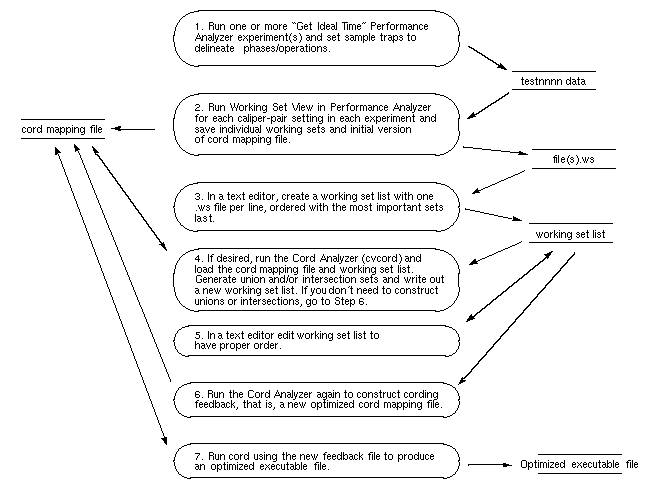
Figure 4-33 presents an overview of the process of conducting working set analysis.
First you conduct one or more Performance Analyzer experiments using the "Get Ideal Time (pixie) per function & source line" task. You need to set sample traps at the beginning and end of each operation or phase that represents a distinct task. If you want, you can run additional experiments on the same executable to collect data for other situations in which it can be used.
After you have collected the data for the experiments, you run the Performance Analyzer and select Working Set View. You need to save the working set for each phase or operation that you wish to improve. Do this by setting the calipers to bracket each phase and selecting "Save Working Set" from the Admin menu.
You also must select "Save Cord Map File" to save the cord mapping file (for all runs and caliper settings). This need only be done once.
The next step is to create the working set list file, which contains all of the working sets you wish to analyze using the Cord Analyzer. You create the working set list file in a text editor, specifying one line for each working set, in reverse order of priority, that is, the most important comes last.
The working set list and the cord mapping file serve as input to the Cord Analyzer. The working set list provides the Cord Analyzer with working sets to be improved. The cord mapping file provides a list of all the functions in the executable. The Cord Analyzer displays the list of working sets and their utilization efficiency. It lets you
examine the page layout and efficiency of each working set with respect to the original ordering of the executable
construct union and intersection sets as desired
view the efficiency of a different ordering
construct a new cord mapping file as input to the cord utility
If you have a new order that you would like to try out, edit your working set list file in the desired order, submit it to the Cord Analyzer, and save a new cord mapping file for input to cord.
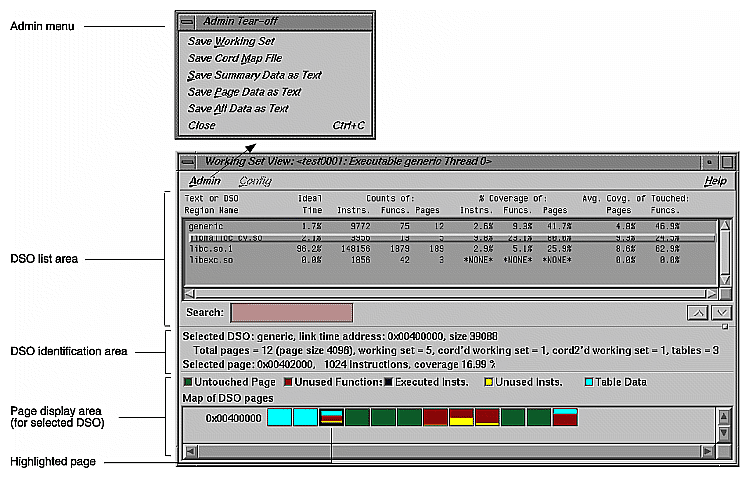
Working Set View measures the coverage of the dynamic shared objects (DSOs) that make up your executable (see Figure 4-34). It indicates instructions, functions, and pages that were not used when the experiment was run. It shows the coverage results for each DSO in the DSO list area. Clicking a DSO in the list displays its pages with color-coding to indicate the coverage of the page.
The DSO list area displays coverage information for each DSO used by the executable. It has the following columns:
| Text or DSO Region Name |
| |
| Ideal Time |
| |
| Counts of: Instrs. |
| |
| Counts of: Funcs. |
| |
| Counts of: Pages |
| |
| % Coverage of: Instrs. |
| |
| % Coverage of: Funcs. |
| |
| % Coverage of: Pages |
| |
| Avg. Covg. of Touched: Pages |
| |
| Avg. Covg. of Touched: Funcs |
|
The Search field lets you perform incremental searches to find DSOs in the DSO list. (An incremental search goes to the immediately matching target as you enter each character.)
The DSO identification area shows the address, size, and page information for the selected DSO. It also displays the address, number of instructions, and coverage for the page selected in the page display area.
The page display area at the bottom of the window shows all the pages in the DSO and indicates untouched pages, unused functions, executed instructions, unused instructions, and table data (related to rld). It also includes a color legend at the top to indicate how pages are used.
Clicking a page displays its address, number of instructions, and coverage data in the identification area. Clicking a function in the function list of the main Performance Analyzer window highlights (using a solid rectangle) the page on which the function begins. Clicking the left mouse button on a page indicates the first function on the page by highlighting it in the function list area of the Performance Analyzer window. Similarly, clicking the middle button on a page highlights the function at the middle of the page and clicking the right button highlights the button at the end of the page. For all three button clicks, the page containing the beginning of the function becomes highlighted. Note that left clicks typically highlight the page before the one clicked since the function containing the first instruction usually starts on the previous page.
The Admin menu provides these menu selections:
| "Save Working Set" |
| |
| "Save Cord Map File" |
| |
| "Save Summary Data as Text" |
| |
| "Save Page Data as Text" |
| |
| "Save All Data as Text" |
| |
| "Close" |
|
The Cord Analyzer is not actually part of the Performance Analyzer; it's discussed in this part of the manual because it works in conjunction with Working Set View. The Cord Analyzer lets you explore the working set behavior of an executable or shared library (DSO). With it you can construct a feedback file for input to cord to generate an executable with improved working-set behavior. You invoke the Cord Analyzer using this syntax at the command line:
cvcord -L executable [-fb feedbackFile] [-wsl workingsetList] [-ws workingsetFile] [-scheme schemeName] |
where
| -L executable |
| |
| -fb feedbackFile |
| |
| -wsl workingsetList |
| |
| -ws workingsetFile |
| |
| -scheme schemeName |
|
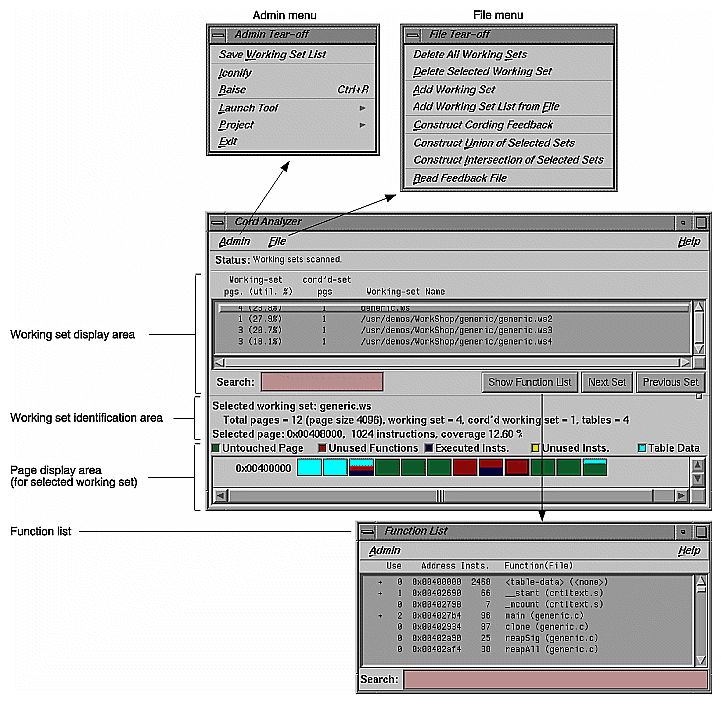
The Cord Analyzer is shown in Figure 4-35 with its major areas and menus labeled.
The working set display area shows all of the working sets included in the working set list file. It has the following columns:
| Working-set pgs. (util. %) |
| |
| cord'd set pgs |
| |
| Working-set Name |
|
Note also that when the Function List is displayed, double-clicking a function displays a plus sign (+) in the working set display area to the left of any working sets that contain the function.
The working set identification area shows the name of the selected working set. It all shows the number of pages in the working set list, in the selected working set, in the cord'd working set, and used as tables. It also provides the address for the selected page, its size, and its coverage as a percentage.
The page display area at the bottom of the window shows the starting address for the DSO, its pages and their use in terms of untouched pages, unused functions, executed instructions, unused instructions, and table data (related to rld). It also includes a color legend at the top to indicate how pages are used.
The Function List displays all the functions in the selected working set. It contains these columns:
| Use |
| |
| Address |
| |
| Insts. |
| |
| Function (File) |
|
Note also that when the Function List is displayed, clicking a working set in the working set display area displays a plus sign (+) in the function list to the left of any functions that the working set contains. Similarly, double-clicking a function displays a plus sign in the working set display area to the left of any working sets that contain the function.
The Search field lets you do incremental searches for function in the Function List.
The Admin menu contains the standard Admin menu commands in WorkShop views (see "Admin Menu" in the ProDev WorkShop Debugger User's Guide). It has one command specific to the Cord Analyzer:
| "Save Working Set List" |
|
The File menu contains these commands:
| "Delete All Working Sets" |
| |
| "Delete Selected Working Set" |
| |
| "Add Working Set" |
| |
| "Add Working Set List from File" |
| |
| "Construct Cording Feedback" |
| |
| "Construct Union of Selected Sets" |
| |
| "Construct Intersection of Selected Sets" |
| |
| "Read Feedback File" |
|
