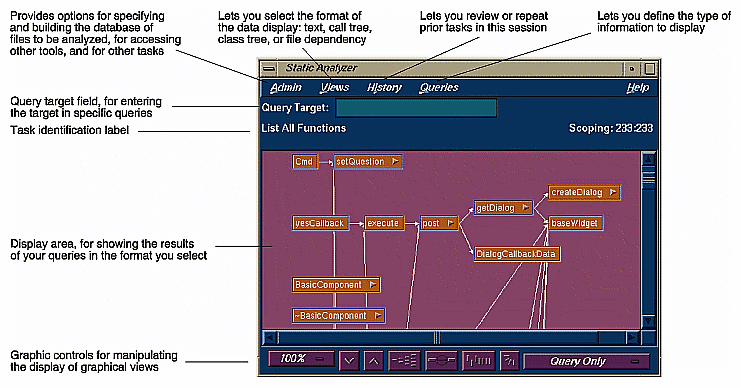
The Static Analyzer is a source code analysis and navigation tool for analyzing source code written in C, C++ or Fortran 77. The Browser has additional features for C++, which are described in “Browser User Model”.
| Note: Support for Fortran 90 is limited to the MIPSPro Fortran 90 compiler, version 7.1, and newer. |
The Static Analyzer shows you code structure (graphically or in text format) including function calls, definitions of variables, file dependencies, macro locations, class hierarchies, file dependencies, and other structural details for understanding your code. You can also make specific queries, such as showing where a function is used. You can even analyze programs that don't compile, a particularly helpful feature for those porting code.
The Static Analyzer works by reading through source code files that you specify and creating a database of program elements such as functions, files, classes, methods, packages, and their relationships. The main Static Analyzer window with a typical call graph is illustrated in Figure 3-1.
The following steps outline basic static analysis:
Invoke the Static Analyzer, either by typing cvstatic or by selecting Static Analyzer from the Launch submenu in any ProDev WorkShop Admin menu (preferably from the directory where your source code is located).
Decide which files to analyze.
You designate which files to analyze in a special file called a fileset. A fileset is a regular ASCII file with a format of one entry per line, each line separated from the next by a carriage return. Entries can be regular expressions, filenames, or included directories preceded by the designator -I.
To specify a fileset, you can use any of the following methods:
Create the fileset manually, using a text editor.
Use the Fileset Editor, which is accessed from the Admin menu in the Static Analyzer window.
Let the Static Analyzer create the fileset automatically at startup by defaulting to the files in the current directory that match the expression *.[c|C|f|F].
Let the Static Analyzer create the fileset automatically at startup from the command line by typing cvstatic with the -executable flag and designating the name of an executable file.
Many programs are so large that a query covering the entire scope is not helpful because of the size and complexity of the results. There are two ways to keep the scope of your analysis at a manageable size:
Limit the number of files to be analyzed.
Avoid queries that begin with List All ....
Decide how you are going to build the database.
Before you can specify a fileset, you must decide how you are going to build the database. You can choose to create the database in scanner mode (the default), which is fast but not sensitive to any specific programming language; or in parser mode, which uses the compiler and is slower but more thorough. Use scanner mode for large programs or for programs that do not compile. Scanner mode is particularly suited to porting situations. Parser mode is better when you have code that compiles and you need to determine language-specific relationships.
Build the database.
Perform your queries. Queries are selected from the Queries menu in the Static Analyzer.
View and save the results.
The Static Analyzer can present data in several ways that are selected from the Views menu. The following displays are available:
Text View displays query results in a text format. In addition to listing the queried items, it indicates the source file name and line number, and includes the actual source line.
Call Tree View applies to function queries. It presents the data in a graphical format with nodes (rectangles) representing functions and arcs (arrows) representing calls to functions.
Class Tree View applies to C++ class queries. It presents a class inheritance tree with nodes representing classes and arcs representing parent-child class relationships.
File Dependency View applies to file queries. It presents a graph, with nodes representing files and arcs representing include relationships.
If you want to save a query in a graphical view, you can save a PostScript version by selecting Save Query... from the Admin menu and print later.
Access the source code.
Double-clicking any node in a graph or item in Text View brings up the Source View window containing the corresponding source code. Double-clicking any arc (arrow) displays the Source View window with the corresponding call site or file inclusion.
The following table details where to find more information about the Static Analyzer in the ProDev WorkShop: Static Analyzer User's Guide.
Table 3-1. Static Analyzer Information Details
Topic | See ... |
|---|---|
General Static Analyzer description | Chapter 1, “Introduction to the WorkShop Static Analyzer” |
Static Analyzer tutorial | Chapter 2, “Tutorials for the Static Analyzer” |
Creating filesets and a database | Chapter 3, “Creating a Fileset and Generating a Database" |
Performing queries | Chapter 4, “Queries” |
Static Analyzer viewing formats | Chapter 5, “Views” |
Strategies for analyzing large programs | Chapter 6, “Working in Large Programming Projects” |
The Browser user model is similar to the Static Analyzer user model. After building the database (which must be done in parser mode), access the Browser by selecting Browser from the Static Analyzer Admin menu.
The Browser lets you display different sets of information including relationships about C++ classes and members through the following views:
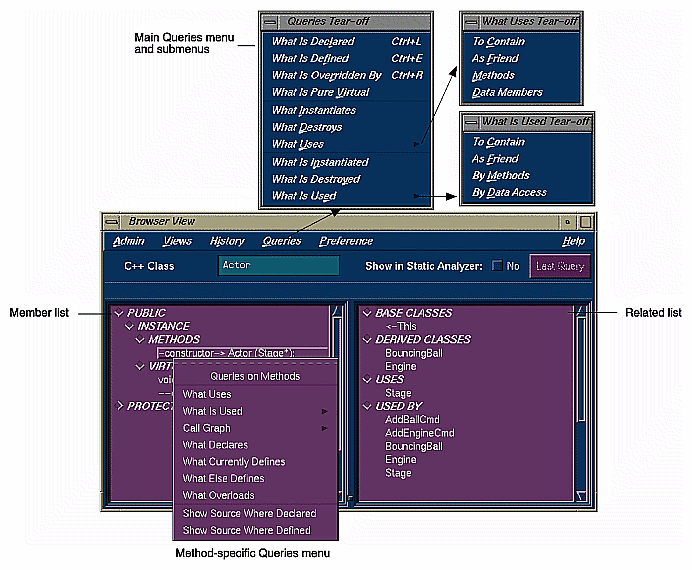
Browser View--displays member and related information in an expandable, hierarchical outline format with the members of the current class, package, tagged type, or task in the left pane and related elements on the right (see Figure 3-2). Clicking the diamond-shaped icons next to the headings in the list hides or displays the associated information.
As in the Static Analyzer, numerous queries are available through the Query menu. In addition, if you select an item in either of the Browser View lists and hold down the right mouse button, you can access the Queries menu specific to that type of item, that is, methods, data members, classes, and so on.
You can create man page templates for classes, packages, tasks, or tagged types by selecting Generate man pages... from the Browser View Admin menu. You simply specify one or more elements, click the Generate button, and the Browser fills in the man page template for you. Similarly you can create web pages by selecting Generate web pages... from the Browser View Admin menu.
Graph Views window--displays the hierarchy for the subject currently dislayed in the Browser View window with nodes as subjects and arcs as relationships. This window can show four types of relationships: inheritance, containment, interaction, and friends. You can display all subjects, limit the scope to those derived from the current subject, or get a butterfly view showing the immediate base and derived subjects of the current one.
Call Graph window--displays the calling relationships of methods, virtual methods, or functions selected from Browser View with options for customizing the display of the graph.
The following table details where to find more information about the Browser in the ProDev WorkShop: Static Analyzer User's Guide.
Table 3-2. Browser Information Details
Topic | See ... |
|---|---|
General Browser description | Chapter 7, “Getting Started with the Browser” |
C++ Browser tutorial | Chapter 8, “Browser Tutorial for C++” |
Detailed reference information | Chapter 10, “The Browser Reference” |

