The ProDev WorkShop Performance Analyzer helps you understand how your program performs so that you can correct any problems. In performance analysis, you run experiments to capture performance data and see how long each phase or part of your program takes to run. You can then determine if the performance of the phase is slowed down by the CPU, I/O activity, memory, or a bug, and you can attempt to speed it up.
A menu of predefined tasks is provided to help you set up your experiments. With the Performance Analyzer views, you can conveniently analyze the data. These views show CPU utilization and process resource usage (such as context switches, page faults, and working set size), I/O activity, and memory usage (to capture such problems as memory leaks, bad allocations, and heap corruption).
The Performance Analyzer has three general techniques for collecting performance data:
Counting: counts the exact number of times each function or basic block has been executed. This requires instrumenting the program, that is, inserting code into the executable file to collect counts.
Profiling: periodically examines and records a program's program counter (PC), call stack, and resource consumption.
Tracing: traces events that affect performance, such as reads and writes, MPI calls, system calls, page faults, floating-point exceptions, and mallocs, reallocs, and frees.
The Performance Analyzer can record a number of different performance experiments, each of which provides one or more measures of code performance.
To set up a performance experiment, select a task from the Select Task submenu on the Perf menu in the Debugger Main View. The Select Task menu lets you select among several predefined experiment tasks. If you have not formed an opinion of where performance problems lie, select either the Profiling/PC Sampling task or the User Time/Callstack Sampling task. They are useful for locating general problem areas within a program.
Start the program by clicking the Run button in Main View.
After the experiment has finished running, you can display the results in the Performance Analyzer window by selecting Performance Analyzer from the Launch submenu in any ProDev WorkShop Admin menu or by typing the following:
% cvperf -exp experimentname
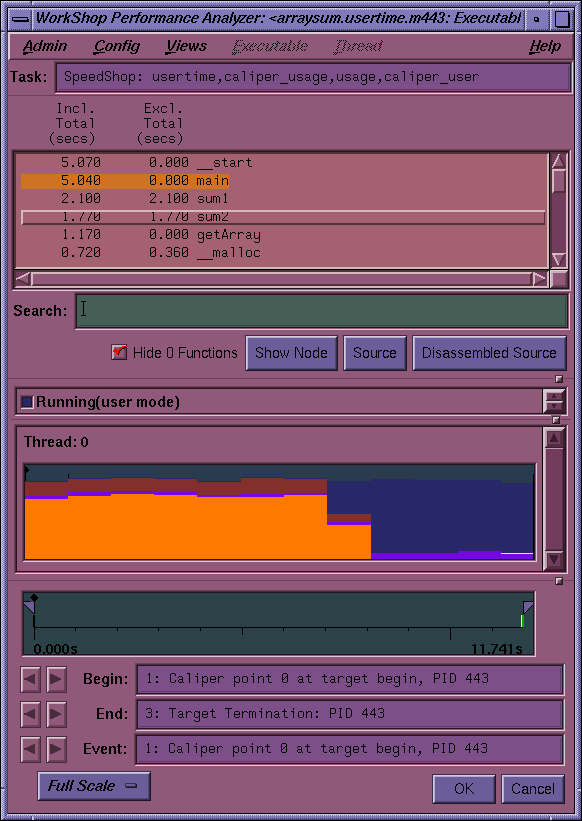
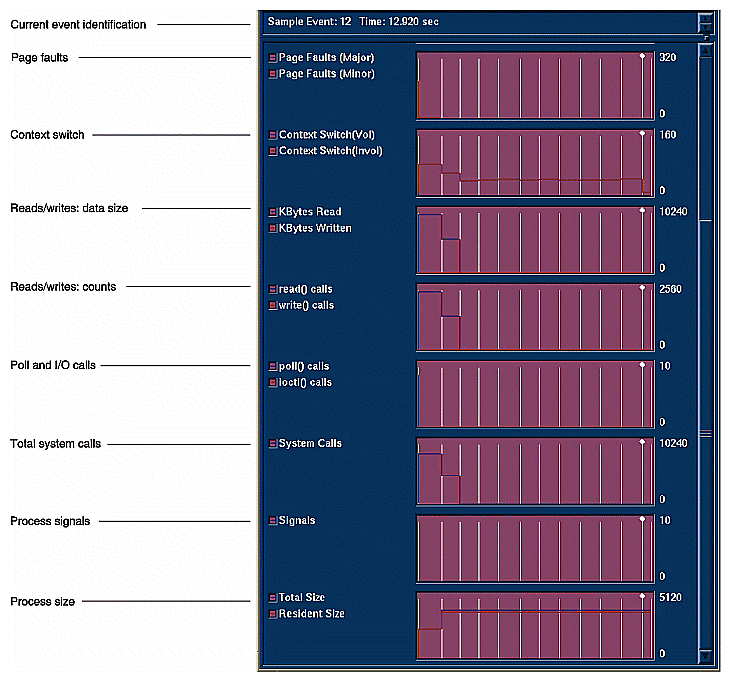
Results from a typical performance analysis experiment appear in Figure 4-1, the main Performance Analyzer window, and Figure 4-2, which shows a subset of the graphs in the Usage Views (Graphs) window. From the graphs, you should be able to determine where execution phases occur so that you can set traps between them to sample performance data and events at specified times and events during the experiment.
Setting traps to sample data between execution phases isolates the data to be analyzed on a phase-by-phase basis. To set a sample trap, select Sample, Sample at Function Entry, or Sample at Function Exit from the Set Trap submenu in the Traps menu in the Debugger Main View or through the Traps Manager window.
Select your next experiment from the Task menu in the Performance Pane and run it by clicking the Run button in Main View.
At this point you need to form a hypothesis about the source of the performance problem and select an appropriate task from the Select Task menu for your next experiment.
When the results of the second experiment are returned to you, you can analyze the results by using the Main View, any of its views, or Source View with performance data annotations displayed.
The Performance Analyzer provides results in the windows listed in Table 4-1.
Table 4-1. Performance Analyzer Views and Data
Performance Analyzer Window
Data Provided
Performance Analyzer Main View
Function list with performance data, usage chart showing general resource usage over time, and time line for setting scope on data
Call Stack View
Call stack recorded when selected event occurred
Usage View (Graphs)
Specific resource usage over time, shown as graphs
Usage View (Numerical)
Specific resource usage for selected (by caliper) time interval, shown as numerical values
Call Graph View
A graph showing functions that were called during the time interval, annotated by the performance data collected
I/O View
A graph showing I/O activity over time during the time interval
Malloc View
A list of all mallocs, their sizes and number of occurrences, and, if selected, their corresponding call stack within the selected time interval
Malloc Error View
A list of mallocs errors, their number of occurrences, and if selected, their corresponding call stack within the time interval
Leak View
A list of specific leaks, their sizes and number of occurrences, and if selected, their corresponding call stack within the time interval
Heap View
A generalized view of heap memory within the time interval
Source View
The ProDev WorkShop text editor window showing source code annotated by performance data collected
Working Set View
The instruction coverage of dynamic shared objects (DSOs) that make up the executable, which shows instructions, functions, and pages that were not used within the time interval
Butterfly View
The callers and callees of designated functions.
MPI Stats View (Graphs)
A display of various MPI information in the form of graphs.
MPI Stats View (Numerical)
A display of various MPI information in the form of text.
Cord Analyzer
The Cord Analyzer is not actually part of the Performance Analyzer, but it works with data from Performance Analyzer experiments. It allows you to arrange functions in defferent orders to determine the effect on performance.
The following table details where to find more information about the Performance Analyzer in the ProDev WorkShop: Performance Analyzer User's Guide.
Table 4-2. Performance Analyzer Details
Topic | See |
|---|---|
General Performance Analyzer information | Chapter 1, ''Introduction to the Performance Analyzer'' |
General tutorial | Chapter 2, ''Performance Analyzer Tutorial'' |
Setting up experiments | Chapter 3, ''Setting up Performance Analysis Experiments'' for details and Chapter 4, ''Selecting Performance Tasks'' heading for a summary |
Setting sample traps | Chapter 3, ''Setting Sample Traps'' subsection |
Main View | Chapter 4, ''The Performance Analyzer Main Window'' subsection |
Usage View (Graphs)window | Chapter 4, ''The Usage View (Graphs) Window'' subsection |
Watching an experiment using Process Meter | Chapter 4, ''The Process Meter Window'' subsection |
Tracing I/O calls using the I/O Viewwindow | Chapter 4, ''The I/O View Window'' subsection |
Call Graph Viewwindow | Chapter 4, ''The Call Graph View Window'' subsection |
Finding memory problems | Chapter 4, ''Analyzing Memory Problems'' subsection |
Call Stack View window | Chapter 4, ''The Call Stack Window''subsection |