This chapter presents a tutorial for using the Performance Analyzer and covers these topics:
 | Note: Because of inherent differences between systems and also due to concurrent processes that may be running on your system, your experiment will produce different results from the one in this tutorial. However, the basic form of the results should be the same. |
This tutorial is based on a sample program called arraysum. The arraysum program goes through the following steps:
defines the size of an array (2,000 by 2,000)
creates a 2,000-by-2,000 element array, gets the size of the array, and reads in the elements
calculates the array total by adding up elements in each column
recalculates the array total differently, by adding up elements in each row
As you probably can already guess, it is more efficient to add the elements in an array row-by-row, as in step 4, than column-by-column, as in step 3. Because the elements in an array are stored sequentially by rows, adding the elements by columns potentially causes context switches, page faults, and cache misses. The tutorial shows you how you can detect symptoms of problems like this and then zero in on the problem. The source code is located in /usr/demos/WorkShop/performance/tutorial if you wish to examine it.
You need to compile the program first so that you can use it in the tutorial.
Change to the /usr/demos/WorkShop/performance directory.
You can run the experiment in this directory or set up your own directory. You'll need the arraysum.c file in either case.
Compile the arraysum.c file by typing make arraysum
This will provide you with an executable for the experiment.
From the command line, type cvd arraysum&
The Debugger Main View window is displayed. You need the Debugger to specify the data to be collected and run the experiment.
Choose "Identify bottleneck resources & phases" from the "Select Task..." submenu in the Perf menu.
This is a general-purpose performance task that will help us determine the phases of the program and view basic resource usage.
Click Run in the Debugger Main View window.
This starts the experiment. When the status line indicates that the process has terminated, the experiment has completed and the main Performance Analyzer window is displayed automatically. The experiment may take one to three minutes, depending on your system.
Performance analysis experiments are set up and run in the Debugger window; the data is analyzed in the main Performance Analyzer window.
Examine the main Performance Analyzer window.
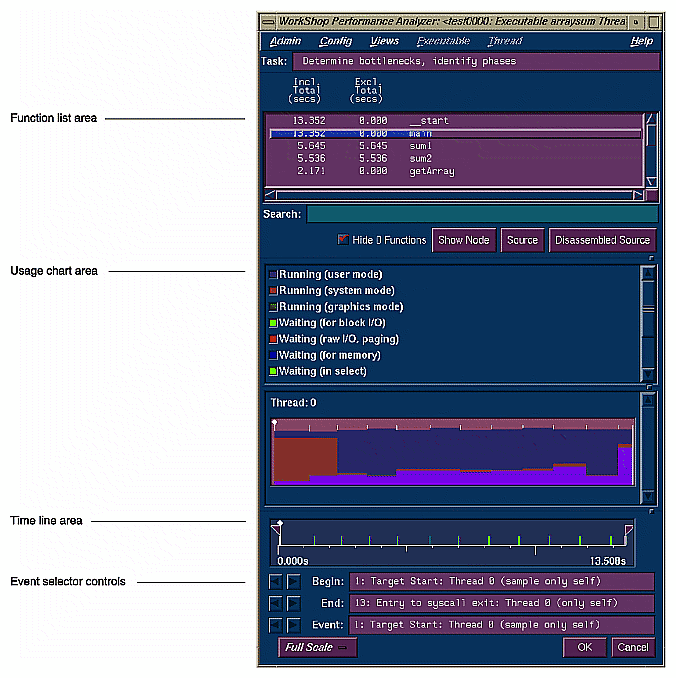
The Performance Analyzer window now displays the information from the new experiment (see Figure 2-1).
Look at the Usage Chart in the Performance Analyzer window.
There are three general phases. The first phase is I/O-intensive, as evidenced by the high system time. The middle phase takes up most of the experiment. We do not have enough information yet, however, to characterize it. The third phase shows high user time and is CPU-intensive.
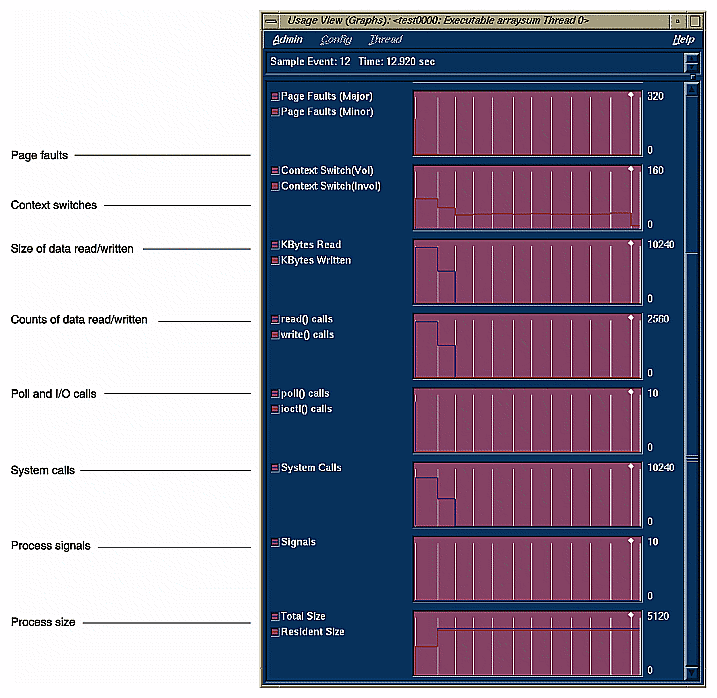
Select "Usage View (Graphs)" from the Views menu.
The Usage View (Graphs) window displays as in Figure 2-2. This indicates that there are significant page faults and context switches in the middle phase. It also shows high read activity and system calls in the first phase, confirming our hypothesis that it is I/O -intensive.
As a side note, notice that the last chart indicates that the maximum total size of the process is reached at the end of the first phase and does not grow thereafter.
Select "Call Stack" from the Views menu.
The call stack displays for the selected event. An event refers to a sample point on the time line (or any usage chart).
At this point, no events have been selected so the call stack is empty. To select events, you can click in the time line or usage chart. You can also click the event selector controls to make one event at a time (see Figure 2-1).
The call stack window indicates the state of the call stack when the event occurred. The significance of the call stack is that it lets you map events to the functions in which they occurred.
Select some random events and watch the call stack.
This exercise helps you see the connection between events and call stacks.
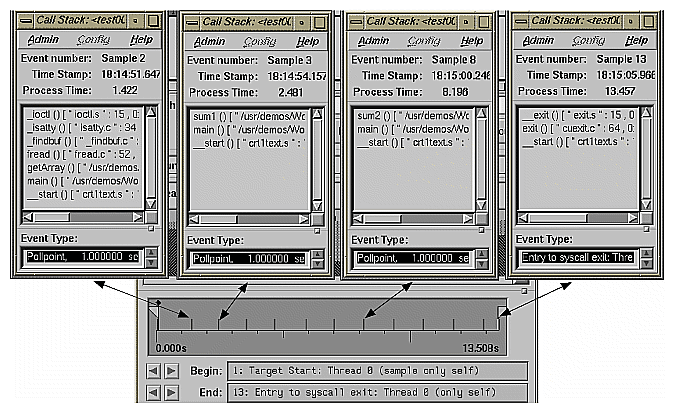
The important call stacks are the ones that occur at the beginning and end of phases. The general approach is to click in the vicinity of a usage chart where you think a phase boundary may occur and then check the call stack at that point. In this example, events #2, #3, #8, and #13 are important. The call stacks for these events are shown in Figure 2-3, which is drawn to illustrate the relationships, although you can't actually display multiple call stacks at the same time. Remember that your results will be different.
Event #2 is the last event in the first phase. Events #3 and #7 are the first and last events in the sum1 function. Event #8 shows the switch from sum1 to sum2 and represents the beginning of the last phase. The length of time in sum1 indicates potential problems.
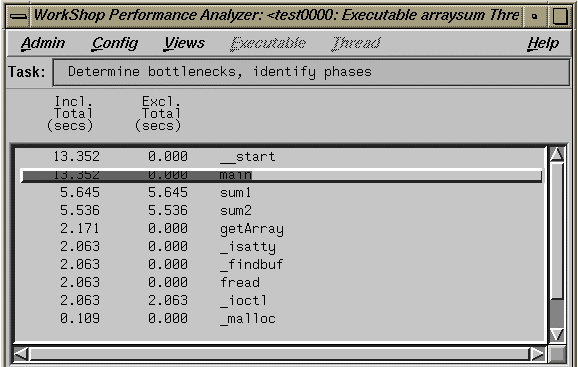
Return to the Performance Analyzer window and pull down the sash to expose the complete function list.
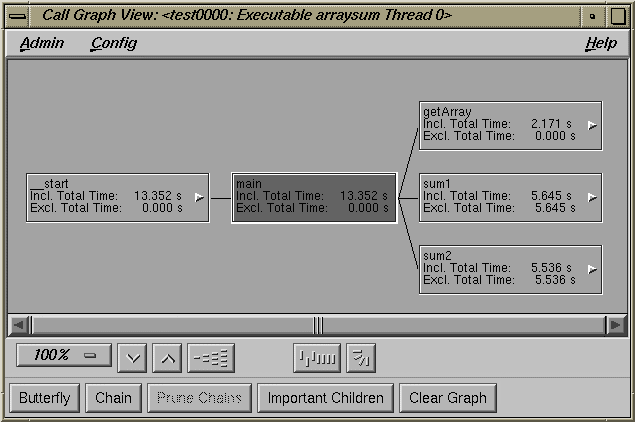
This shows the inclusive time (that is, time spent in the function and its called functions) and exclusive time (time in the function itself only) for each function. As you can see, 5.645 seconds are spent in sum1 and 5.536 seconds in sum2.
Select "Call Graph View" from the Views menu and click the Butterfly button.
The call graph provides an alternate means of viewing function performance data. It also shows the relationships, that is, which functions call which functions. After the Butterfly button is clicked, Call Graph View displays as in Figure 2-5. The Butterfly button takes the selected function (or most active function if none is selected) and displays it with the functions that call it and those that it calls.
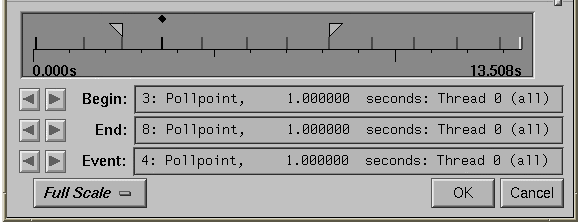
Select "Close" from the Admin menu in the Call Graph View to close it. Return to the main Performance Analyzer window and move the left caliper (Begin) to event #3 and the right caliper (End) to event #8.
This is shown in Figure 2-6. Moving the calipers like this lets us focus on the data between event #3 and event #8.
Select "Usage View (Numerical)" from the Views menu.
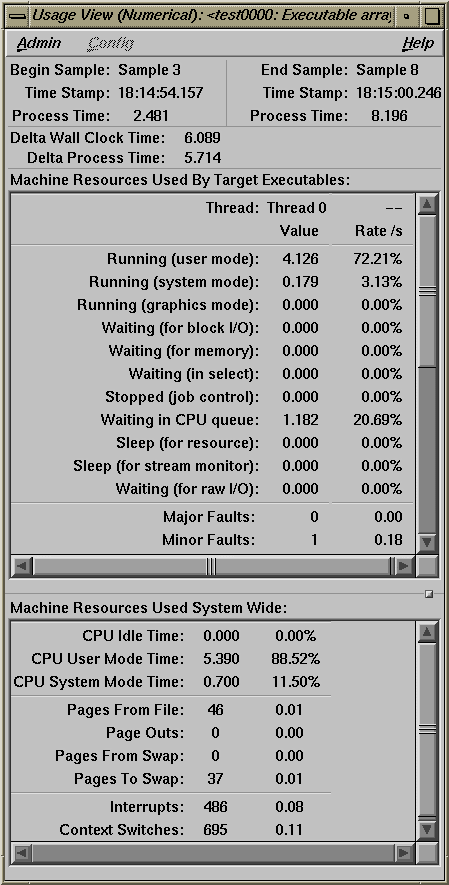
The Usage View (Numerical) window displays as shown in Figure 2-7.
This view provides the performance metrics for the interval defined by the calipers, in this case the sum1 phase.
Return to the main Performance Analyzer window, select sum1 from the function list, and click Source.
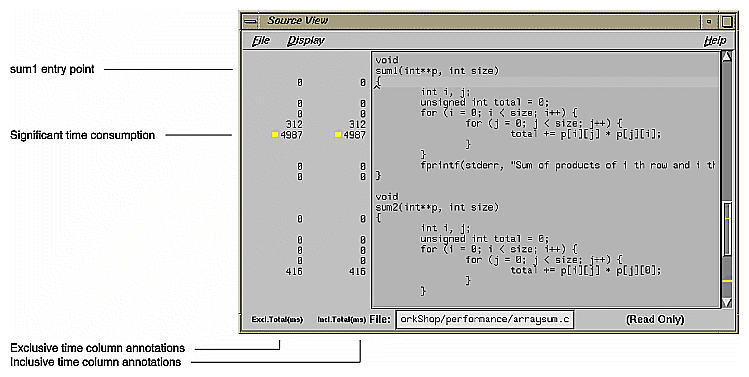
The Source View window displays as in Figure 2-8, scrolled to sum1, the selected function. The annotation column to the left of the display area shows the performance metrics by line. Lines consuming more than 90% of a particular resource appear with highlighted annotations.
Notice that the line where the total is computed in sum1 is seen to be the culprit, consuming 4,987 milliseconds. As in the other WorkShop tools, you can make corrections in Source View, recompile and try out your changes.

Note: At this point, we have uncovered one performance problem, that the sum1 algorithm is inefficient. As a side exercise, you may wish to take a look at the performance metrics at the assembly level. To do this, return to the main Performance Analyzer window, select sum1 from the function list, and click Disassembled Source. Disassembly View displays, with the performance metrics in the annotation column.
Close any windows that are still open.
This concludes the tutorial.
