Traps are also referred to as breakpoints, watchpoints, samples, signals, and system calls. Setting traps is one of the most valuable functions of a debugger or performance analyzer. A trap enables you to select a location or condition within your program at which you can stop the execution of the process, or collect performance data and continue execution. You can set or clear traps from the Main View window or the Trap Manager window. You can also specify traps in the Debugger command line at the bottom of the Main View window. For signal traps, you can also use the Signal Panel window; and for system call traps, use the Syscall Panel window.
When you are debugging a program, you typically set a trap in your program to determine if there is a problem at that point. The Debugger lets you inspect the call stack, examine variable values, or perform other procedures to get information about the state of your program.
Traps are also useful for analyzing program performance. They let you collect performance data at the selected point in your program. Program execution continues after the data is collected.
This chapter covers the following topics:
For a tutorial on the use of traps, see “Setting Traps” in Chapter 4.
A trap is an intentional process interruption that can either stop a process or capture data about a process. It has two parts: the trigger that specifies when the trap fires and the action that specifies what happens when the trap fires.
You can set traps at a specified location in your program or when a specified event occurs. You can set a trigger at any of the following points:
At a given line in a file (often referred to as a breakpoint)
At a given instruction address
At the entry or exit for a given function
After set time intervals (referred to as a pollpoint )
When a given variable or address is read, written, or executed (referred to as a watchpoint)
When a given signal is received
When a given system call is entered or exited
In addition, you can use an expression to specify a condition that must be met before a trap fires. You can also specify a cycle count , which specifies the number of passes through a trap before firing it.
When you set a breakpoint in C++ code that uses templates, that breakpoint is set in each instantiation of the template.
Traps can affect any of a number of actions in your debugging process. The following is a list of the variety of traps and their functions. See “Syntaxes” for trap syntaxes.
A stop trap causes one or all processes to stop. In single process debugging, a stop trap stops the current process. In multiprocess debugging, you can specify a stop trap to stop all processes or only the current process.
A pending trap is a trap with a destination address that does not resolve at the initial startup of the debugger: it allows you to place breakpoints on names that do not yet exist. By enabling pending traps, you make unknown function names acceptable breakpoint locations or entries. Because of this, the trap manager will not error a pending trap off if it can not be found in the executable. Instead, when a dlopen of a DSO (dynamic shared object) occurs, and the function name is found that matches the trap, the trap is resolved and becomes active.
There are two ways to enable pending traps.
Only “stop entry”, “stop in”, and “stop exit” traps can be pending traps, not “stop at” traps. The debugger only accept a “stop at” trap on a DSO (dynamic shared object) and line number loaded at startup. (See “Syntaxes” for trap syntaxes.)
To get around this, set a pending “stop in” trap and run to the trap location. Now you can set “stop at” traps because the DSO is loaded. The debugger then remembers these traps if you run, kill, and re-run within a single session.
Pending traps display with the prefix (pending) preceding the normal trap display line.
Breakpoints on misspelled names are not flagged as errors when pending traps are enabled. This is because the Debugger has no way of knowing if a pending trap will ever be tripped.
A sample trap collects performance data. Sample traps are used only in performance analysis, not in debugging. They collect data without stopping the process. You can specify sample traps to collect such information as call stack data, function counts, basic block counts, PC profile counts, mallocs/frees, system calls, and page faults. Sample traps can use any of the triggers that stop traps use. Sample traps are often set up as pollpoints so that they collect data at set time intervals.
An exception trap fires when a C++ exception is raised.
You can add a conditional expression to an exception trap through the Trap Manager window. However, the context in which the expression is evaluated is not that of the throw; the context is the exception handling of the C++ runtime library. Therefore, only global variables have unambiguous interpretation in the if clause.
You should not include complex expressions involving operators such as * and & in your type specification for an exception trap. If you create an exception trap with a specific base type, however, you also stop your program on throws of pointer, reference, const, and volatile types. For example, if you use the following, your program stops at type char, char*, char&, const char&, and so forth.:
cvd> stop exception char
You can set traps directly in the Main View window by using the Traps menu or by clicking the mouse in the source annotation column. You can also specify traps at the Debugger cvd command line.
The following sections describe the ways that traps can be set:
The following lists ways to set traps by using your mouse:
The quickest way to set a trap is to click to the left of the source code in the Main View or Source View windows. As you scroll the cursor up and down along the source code, the word “Stop” appears. Click the left mouse button to add or remove a trap. A menu is also available for setting and modifying the trap by holding down the right mouse button in the source annotation column (to the left of the source code).
A subsequent click on the trap removes the trap.
If data collection mode has been specified in the Performance Data window, clicking produces a sample trap; otherwise, a stop trap is entered.
To determine if data collection is on, look at the upper-right corner of the Main View window to see which debugging option is selected ( Debug Only, Performance, or Purify).
The cvd command line is discussed in the cvd(1) man page. stop commands similar to those found in dbx, or as documented in “Setting Single-Process and Multiprocess Traps”, may be entered into the command line portion of the Main View window as an alternative way to set traps.
To set a trap using the Traps menu, you first need to know which type of trap you wish to set, then select the location in your program at which to set the trap.
To set a stop trap or sample trap at a line displayed in the Main View window (or the Source View window), click in the source code display area next to the desired line in the source code, or click-drag to highlight the line. Then, select either Traps -> Set Trap -> Stop or Traps -> Set Trap -> Sample from the menu bar.
For a trap at the beginning or end of a function, highlight the function name in the source code display area and select one of the following from the Traps -> Set Traps submenu as is appropriate to your needs:
Stop At Function Entry
Stop At Function Exit
Sample At Function Entry
Sample At Function Exit
Traps are indicated by icons in the source annotation column (and also appear in the Trap Manager window if you have it open). Sampling is indicated by a dot in the center of the icon. Traps appear in normal color or grayed out, depending on whether they are active or inactive. A transcript of the trap activity appears in the Debugger command line area. The active/inactive nature of traps is discussed in “Enabling and Disabling Traps”.
The Clear Trap selection in the Traps menu deletes the trap on the line containing the cursor. You must designate a Stop or Sample trap type, since both types can exist at the same location appearing superimposed on each other.
When the Group Trap Default toggle is checked (ON), the pgrp option is added into the resulting trap when a trap is set. This option causes the trap to apply to all processes/pthreads in the group of which the current process is a member.
When the Stop All Defaults toggle is checked (ON), the all option is added into the resulting trap when a trap is set. This option causes the trap to apply to all processes/pthreads in the current debugging session.
The Trap Manager window is brought up by selecting Views -> Trap Manager from the Main View window menu bar. This tool helps you manage all traps in a process. Its major functions are to:
List all traps in the process (except signal traps).
Add, delete, modify, or disable the traps listed.
Navigate the user code. Diving or double-clicking on a trap repositions the source in the Main View to the trap location.
The Trap Manager window appears in Figure 5-1 with the Config, Traps, and Display menus shown.
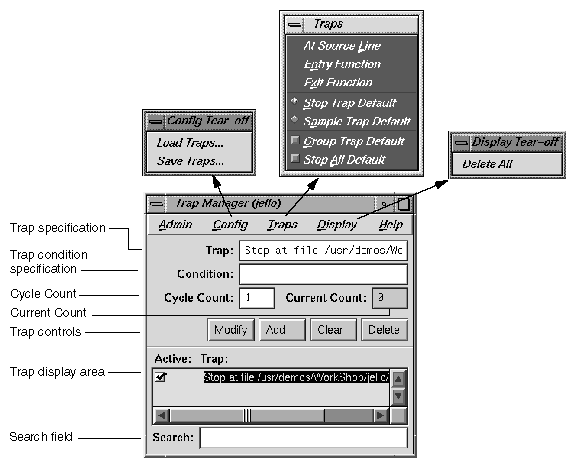
New or modified traps are entered in the Trap field. Traps have the following general form:
[stop|sample] [all] [ pgrp] location | condition
The [stop|sample] option refers to the trap action. You can set a default for the action by using the Stop Trap Default or Sample Trap Default selections of the Traps menu and omitting it on the command line.
The [ all] and [pgrp] options are used in multiprocess analysis. The [all] entry causes all processes in the process group to stop or sample when the trap fires. The [pgrp] entry sets the trap in all processes within the process group that contains the code where the trap is set. You can set a default for the action by setting the Stop All Default or Group Trap Default toggles in the Traps menu.
After you enter the trap (by using the Add or Modify button or by pressing Enter), the full syntax of the specification appears in the field. The Clear button clears the Trap and Condition fields and the cycle fields.
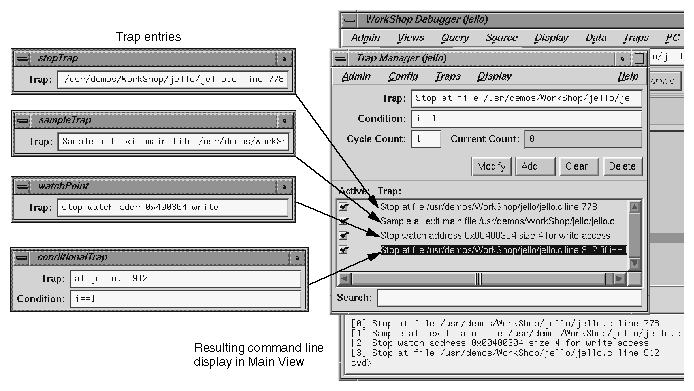
Some typical trap examples are provided in Figure 5-2. The entries made in the Trap field are shown in the left portion of the figure, the trap display in the Trap Manager window resulting from these entries is shown on the right, and the trap display shown at the command line in the Main View window is shown at the bottom.
Specific command syntaxes that may be entered in the Trap text field are shown in the following list.
Setting a Trap in filename at line-number:
[stop|sample] [all][pgrp] at [{file]filename][[line]line-number]This command sets a trap at the specified line in the specified file, for example: Trap: stop at 1449.
Setting a Trap on instruction-address:
[stop | sample] [all] [pgrp] addr instruction-address
This command sets a trap on the specified instruction address. Instruction addresses may be obtained from the Disassembly View window, which is brought up from the Views submenu on the Main View window menu bar. The addresses may be entered as shown, such as '0af8cbb8'X, or as 0x0af8cbb8. For example:
Trap: stop addr 0x0af8cbb8
Setting a Trap on Entry to function:
[stop|sample] [all] [pgrp] entry function[[file] filename]
[stop|sample][all] [pgrp] in function[[file]filename]
This command sets a trap on entry to the specified function. For example:
Trap: stop entry anneal
or
Trap: stop in anneal
If the filename is given, the function is assumed to be in that file's scope.
Setting a Trap on Exit from function:
[stop|sample][all][pgrp] exit function[[file]filename]
This command sets a trap on exit from the specified function. For example:
Trap: stop exit anneal file generic.c
If the filename is given, the function is assumed to be in that file's scope.
Setting a Watchpoint on Specified expression :
[stop|sample][all][pgrp] watch expression[[for] read|write|execute
[access]]
This command sets a watchpoint on the specified expression (using the address and size of the expression for the watchpoint span). The watchpoint may be specified to fire on write, read, or execute (or some combination thereof). If not specified, the write condition is assumed. This syntax has no provision for looking on only a portion of an array. The next syntax item can handle such a request. For example:
Trap: stop watch x for write
Setting a Watchpoint for address and size:
[stop|sample][all][pgrp] watch addr[ess]address[[size]size]
[[for] read|write|execute[access]]
This command sets a watchpoint for the specified address and size in bytes. Typically the expression is the name of a variable. The watchpoint may be specified to fire on write, read, or execute (or some combination thereof) of memory in the given span. If not specified, the size defaults to 4 bytes. Also, if not specified, the write condition is assumed. Addresses may be found by choosing the following from the Main View window menu bar: Views -> Variable Browser or Views -> Data Explorer.
The window displays addresses for arrays and has options to display addresses for other variables. Addresses may be entered in the form 0x0123fabc or '0123fabc'X. For example:
Trap: stop watch addr 0x0123fabc 16
If the array you are watching at address 0x0123fabc is defined such that each element is 4 bytes long, this example trap would be watching 4 adjacent array elements and would cause a stop if any of those 4 elements were updated, since a size of 16 is specified.
Setting a Trap at signal-name:
[stop|sample] [all] [pgrp] signal signal-name
This command sets a trap upon receipt of the given signal. This is the same as the dbx(1) catch subcommand. (For a list of signals, or an alternative way to set traps involving signals, see “Setting Traps by Using Signal Panel and System Call Panel”.) For example:
Trap: stop signal SGIFPE
Setting a Trap on Entry to sys-call-name:
[stop|sample] [all] [pgrp] syscall entry sys-call-name
This command sets a trap on entry to the specified system call. This is slightly different from setting a trap on entry to the function by the same name. A syscall entry trap sets a trap on entry to the actual system call. A function entry trap sets a trap on entry to the stub function that calls the system call. (For a list of system calls, or an alternative way to set traps involving system calls, see “Setting Traps by Using Signal Panel and System Call Panel”.) For example:
Trap: stop syscall entry write
Setting a Trap on Exit from sys-call-name:
[stop|sample] [all] [pgrp] syscall exit sys-call-name
This command sets a trap on exit from the specified system call. This is slightly different from setting a trap on exit from the function by the same name. A syscall exit trap sets a trap on exit from the actual system call. A function exit trap sets a trap on exit from the stub function that calls the system call. (For a list of signals, or an alternative way to set traps involving signals, see “Setting Traps by Using Signal Panel and System Call Panel”.) For example:
Trap: stop syscall exit read
Setting a Trap at time Interval:
[stop|sample] pollpoint [interval] time [seconds]
This command sets a trap at regular intervals of seconds. This is typically used only for sampling. For example:
Trap: stop pollpoint 3
Setting a Trap for C++ Exception
[stop|sample] exception [all | item] itemname
This command sets a trap on all C++ exceptions, or exceptions that throw the base type item.
[stop|sample] exception unexpected [ all|[item[, item]]]
Stops on all C++ exceptions that have either no handler or are caught by an unexpected handler. If you specify item, stops on executions that throw the base type item.
The Condition field in the Trap Manager window lets you specify the condition necessary for the trap to be fired. A condition can be any legal expression and is considered to be true if it returns a nonzero value when the corresponding trap is encountered.
The expression must be valid in the context in which it will be evaluated. For example, a Fortran condition like a .gt .2 cannot be evaluated if it is tested while the program is stopped in a C function.
There are two possible sequences for entering a trap with a condition:
Define the trap.
Define the condition.
Click Add.
or
Define the trap.
Click Add.
Define the condition.
Click Modify (or press Enter).
An example of a trap with a condition is shown in Figure 5-2. The expression i==1 has been entered in the Condition field. (If you were debugging in Fortran, you would use the Fortran expression i .eq .1 rather than i==1.) After the trap has been entered, the condition appears as part of the trap definition in the display area. During execution, any requirements set by the trigger must be satisfied first for the condition to be tested. A condition is true if the expression (valid in the language of the program you are debugging) evaluates to a nonzero value.
The Cycle Count field in the Trap Manager window lets you pass through a trap a specific number of times without firing. If you set a cycle count of n, the trap fires every nth time the trap is encountered. The Current Count field indicates the number of times the process has passed the trap since either the cycle count was set or the trap last fired. The current count updates only when the process stops.
The Traps menu of the Trap Manager window lets you specify traps in conjunction with the Main View or Source View windows. Clicking At Source Line sets a trap at the line in the source display area that is currently selected. To set a trap at the beginning or end of a function, highlight the function name in the source display and click Entry Function or Exit Function.
The trap display area displays all traps set for the current process. There are vertical and horizontal scroll bars for moving around the display area. The Search field lets you incrementally search for any string in any trap.
You can trap signals by using the Signal Panel and set system calls by using System Call Panel (see Figure 5-3).
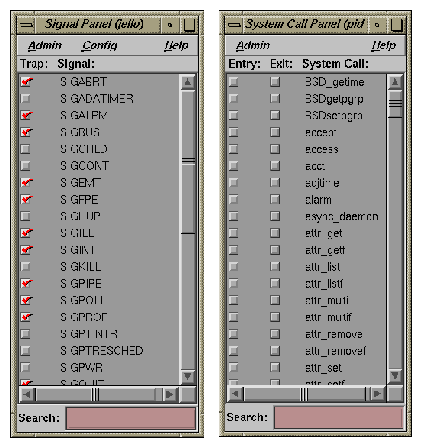
You can select either panel from the Views menu of the Main View window menu bar. The Signal Panel sets a trap on receipt of the signal(s) selected. The System Call Panel sets a trap at the selected entry to or return from the system call.
| Note: When debugging IRIX 6.5 pthreads, the Signal Panel is inaccessible if more than one thread is active. |