The X/Motif Analyzer provides special debugging support for X/Motif applications and is available from the WorkShop Views menu. The X/Motif Analyzer operates in a number of modes (referred to as examiners ) for examining different types of X/Motif objects. The X/Motif Analyzer provides information unavailable through conventional debuggers. It also lets you set widget-level breakpoints and collect X-event history.
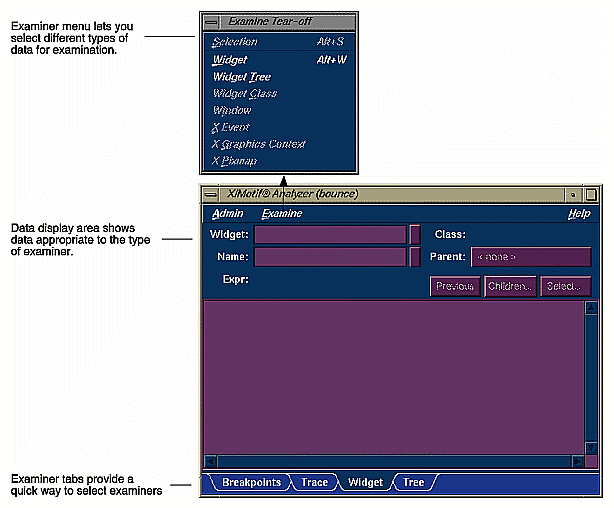
When you first invoke the X/Motif Analyzer, it comes up in widget examiner mode. You can switch to other examiners through the Examiner menu or by clicking the tabs at the bottom of the window (See Figure 6-1).
The X/Motif Analyzer provides the following types of examiners:
Widget examiner--identifies a widget's ID, name, class, and parent, and displays its definitions.
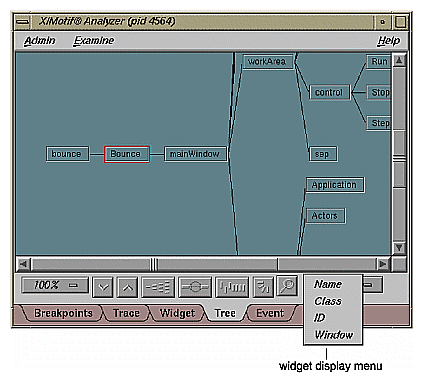
Widget Tree examiner--displays the widget hierarchy (see Figure 6-2). You can display widgets by name, class, or ID by selecting from the widget display menu. Double-clicking a widget node switches to the widget examiner and displays data for the selected widget.
Breakpoints examiner--lets you set breakpoints at the widget and widget-class level. You can set breakpoints at the following levels:
Callback functions
Widget events
Resource changes
Timeout callback functions
Input callback functions
Widget state changes
X events
X requests
Trace examiner--lets you trace the execution of your application and collect the following types of data:
X Server Events
X Server Requests
Widget event dispatch information
Widget resource changes
Widget state changes
X callbacks
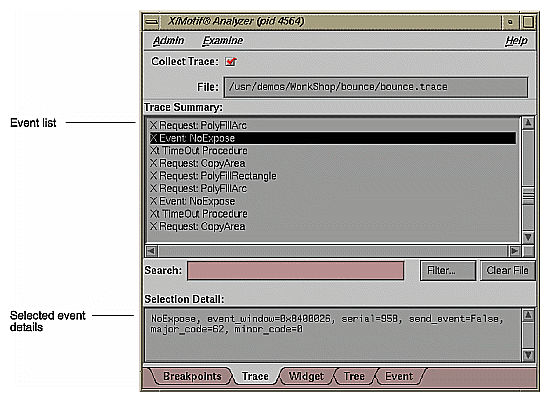
Figure 6-3, is a typical example of the trace examiner. The events appear in a list. Double-clicking an event displays its details.
Callback examiner--comes up automatically when a process stops in a callback. It displays the following information:
Callstack frame for the callback function
Widget information
Callback data structure
Window examiner--identifies the window, its parent and any children, and displays window attribute information.
Event examiner--displays the event structure for a given X event pointer.
Graphics context (GC) examiner--displays the X graphics context attributes for a given GC pointer.
Pixmap examiner--displays the basic attributes of an X pixmap, including size and depth, and can provide an ASCII display of small pixmaps, using the units digit of the pixel values.
Widget class examiner--displays the widget class attributes for a given widget class pointer.
The following table details where to find more information about the X/Motif Analyzer in the ProDev WorkShop: Debugger User's Guide and the ProDev WorkShop: Debugger Reference Manual.
Table 6-1. X/Motif Analyzer Information Details
Topic | See ... |
|---|---|
General information and tutorial | Chapter 11, “X/Motif Analyzer”, in the ProDev WorkShop: Debugger User's Guide |
Detailed reference information | Chapter 4 in the ProDev WorkShop: Debugger Reference Manual |
Setting breakpoints to capture widget-level information | Chapter 4 in the ProDev WorkShop: Debugger Reference Manual, "Breakpoints Examiner” subsection |
Tracing widget-level data through the execution of a program | Chapter 4 in the ProDev WorkShop: Debugger Reference Manual, "Trace Examiner” subsection |
Getting information on a specified widget | Chapter 4 in the ProDev WorkShop: Debugger Reference Manual, "Widget Examiner” subsection |
Displaying a graph of the widget hierarchy | Chapter 4 in the ProDev WorkShop: Debugger Reference Manual, "Tree Examiner” subsection |
Getting information on a specified callback | Chapter 4 in the ProDev WorkShop: Debugger Reference Manual, "Callback Examiner” subsection |
Getting information on a specified window | Chapter 4 in the ProDev WorkShop: Debugger Reference Manual, "Window Examiner” subsection |
Getting information on a specified X event | Chapter 4 in the ProDev WorkShop: Debugger Reference Manual, "Event Examiner” subsection |
Getting information on a specified graphics context | Chapter 4 in the ProDev WorkShop: Debugger Reference Manual, "Graphics Context Examiner” subsection |
Getting information on a specified pixmap | Chapter 4 in the ProDev WorkShop: Debugger Reference Manual, "Pixmap Examiner” subsection |