This chapter is designed to introduce you to the Browser, a facility accessed from the Static Analyzer that shows specific C++ relationships. This chapter describes what you need to run the Browser, shows you how to start it, and presents a brief overview of its main window and menus. To see examples of using the Browser, see Chapter 8, “Browser Tutorial for C++”.
This chapter contains the following sections:
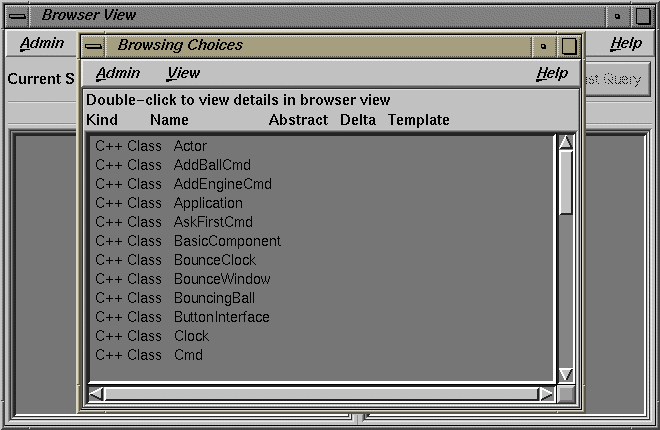
After you have created a fileset and built a static analysis database, you are ready to make object-oriented queries using the Browser. To access the Browser, open the Admin menu in the Static Analyzer and select Browser. The Browser View and the Browsing Choices windows appear as shown in Figure 7-1.
The Browsing Choices window lets you select an item from the fileset to be displayed in the Browser View window. The Browser View window then displays detailed information on the item.
The Browser View window shows you the internal structure and relations of the item you have selected in a textual, outline format. You can also select components of the item and perform queries on them. The results of queries are highlighted in Browser View and can also be displayed in the Static Analyzer. Browser View can display the contents of C++ entities. For the language-specific characteristics, see Chapter 8, “Browser Tutorial for C++” for a C++ sample session.
The Browser displays its data in outline lists in two side-by-side panes in the Browser View window. The lists are in a hierarchical, expandable outline format organized by category. The left pane displays an individual entity and its internals and the right pane displays other items to which that entity is related. When you are looking at C++ code, Browser View displays individual classes and their members in the left pane, and related classes and members in the right pane.
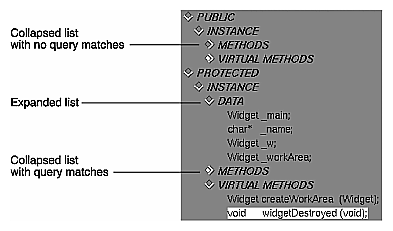
An outline icon is a diamond-shaped, concave icon. It appears to the left of component categories in the lists displayed in the Browser. An outline icon is used to expand or collapse a category. The icon contains an arrow pointing downward if the category is expanded (all items displayed) or to the right if the category is collapsed (all items hidden). Clicking the arrow switches back and forth between collapsing and expanding the category. A right-pointing outline icon that appears filled indicates that one or more of the hidden items satisfy the current query. Figure 7-2 illustrates these conditions.
The Browser View window provides the following menus:
Admin menu--for general housekeeping.
Views menu--for displaying relationships in a graphical format. You can request four variations of class graphs based on these relationships:
Inheritance, which describes the relationship of parent classes to derived classes
Containment, which describes the relationship of container classes to the classes they contain
Interaction, which describes the relationship of classes using methods of other classes
Friends, which describes the relationship of classes declaring other classes as friends
You can also request a call graph to view the relationships of selected methods or functions.
History menu--for going back to a previous Browser activity.
Queries menu--for performing queries on the current item. (You can also perform queries on a selected element in either pane by holding down the right mouse button. These popup queries menus have different selections depending on the type of element.)
Preference menu--for changing the appearance of the display and the behavior enacted by double-clicking with the mouse.
The Current Subject field displays the name of the item you have selected. Its label indicates the kind of item being displayed. Note that the Current Subject field provides a form of file completion; if you enter the partial name of an item and then press the space bar, the name will be completed up to the point that a unique string can be found.
The Show in Static Analyzer toggle lets you display the results of any queries in the Static Analyzer window. The Static Analyzer shows more detail, including source information, than the Browser View does.
The Last Query button lets you display the result of the previous query to the Static Analyzer.
The Browser has annotated scroll bars. This means that when you perform a query, tick marks will appear in the scroll bars (if there are any) to indicate matching elements.

