Appendix H. Results of Operators

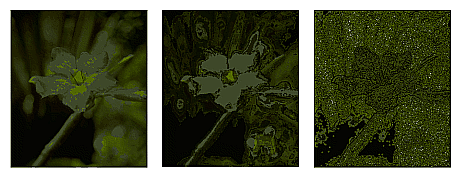
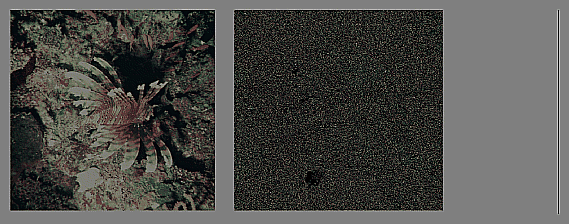
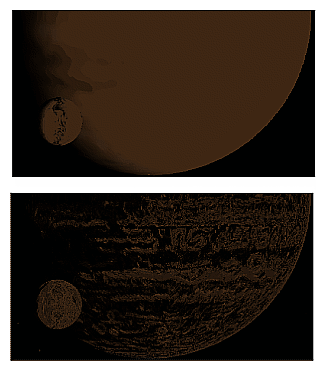
This appendix presents examples in the following sections of all the operators that give visible results:

For more information on using these operators and what effect they have on image data, see Chapter 4, “Operating on an Image.” More specific information on how to apply each operator is located in its header file and in its reference page.

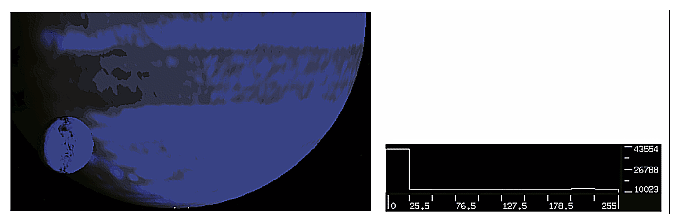
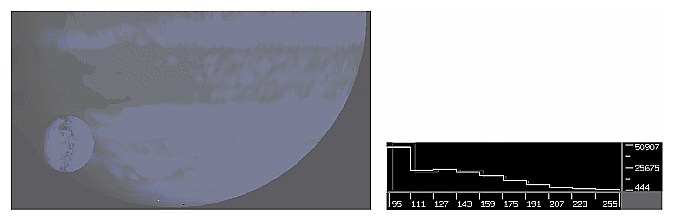
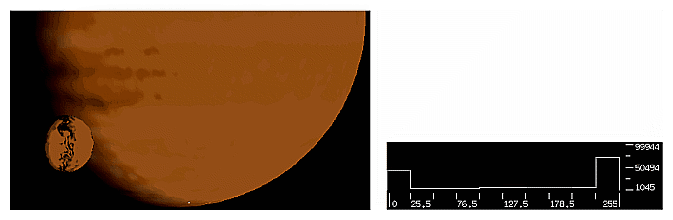
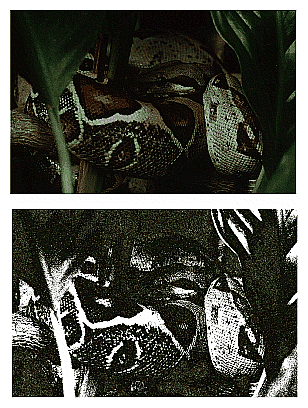
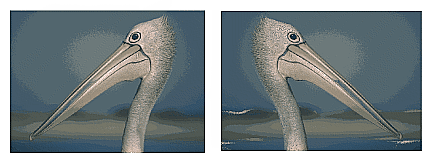
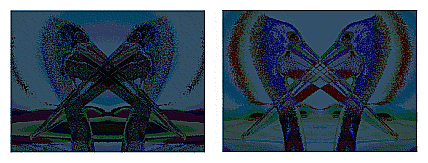
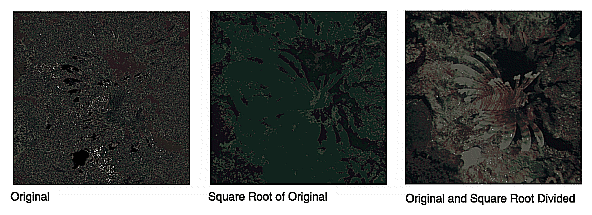
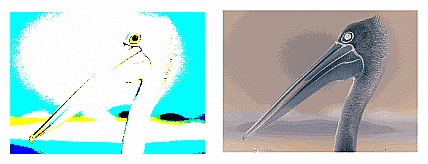
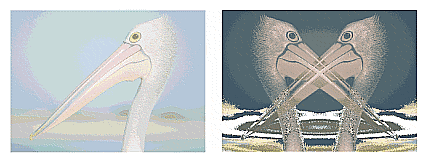
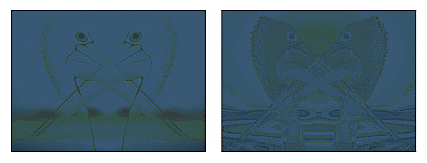
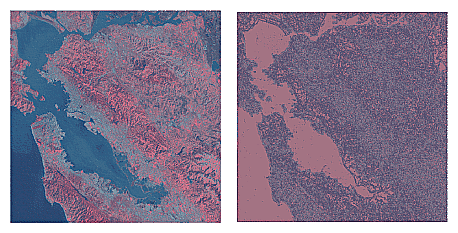
Original, unprocessed images are presented where necessary. Some images combine two original images. These images are either reversed copies of the same image or two extremely similar images.

Color Conversion

Figure H-1. ilFalseColorImg

Figure H-1 ilFalseColorImg

Figure H-2. ilGrayImg

Figure H-2 ilGrayImg

Arithmetic and Logical Transformations

Figure H-3. Original Image and Flipped Image

Figure H-3 Original Image and Flipped Image

Figure H-4. ilAddImg and ilAndImg

Figure H-4 ilAddImg and ilAndImg

Figure H-5. ilDivImg

Figure H-5 ilDivImg

Figure H-6. ilExpImg and ilInvertImg

Figure H-6 ilExpImg and ilInvertImg

Figure H-7. ilLogImg and ilMaxImg

Figure H-7 ilLogImg and ilMaxImg

Figure H-8. ilMinImg and ilMultiplyImg

Figure H-8 ilMinImg and ilMultiplyImg

Figure H-9. ilNegImg and ilOrImg

Figure H-9 ilNegImg and ilOrImg

Figure H-10. ilPowerImg and ilSqRootImg

Figure H-10 ilPowerImg and ilSqRootImg

Figure H-11. ilSquareImg and ilSubtractImg

Figure H-11 ilSquareImg and ilSubtractImg

Figure H-12. ilXorImg

Figure H-12 ilXorImg

Geometric Transformations

Figure H-13. Original and ilRotZoomImg

Figure H-13 Original and ilRotZoomImg

Figure H-14. ilWarpImg

Figure H-14 ilWarpImg

Spatial Domain Transformations

Figure H-15. Original, ilBlurImg and ilGBlurImg

Figure H-15 Original, ilBlurImg and ilGBlurImg

Figure H-16. ilDilateImg, ilErodeImg, and ilMaxFltImg

Figure H-16 ilDilateImg, ilErodeImg, and ilMaxFltImg

Figure H-17. ilMedFltImg, ilMinFltImg, and ilSharpenImg

Figure H-17 ilMedFltImg, ilMinFltImg, and ilSharpenImg

Edge Detection

Figure H-18. ilCompassImg

Figure H-18 ilCompassImg

Figure H-19. ilLaplaceImg (original and filtered image)

Figure H-19 ilLaplaceImg (original and filtered image)

Figure H-20. ilRobertsImg (original and filtered image)

Figure H-20 ilRobertsImg (original and filtered image)

Figure H-21. ilSobelImg (original and filtered image)

Figure H-21 ilSobelImg (original and filtered image)

Frequency Domain Transformations

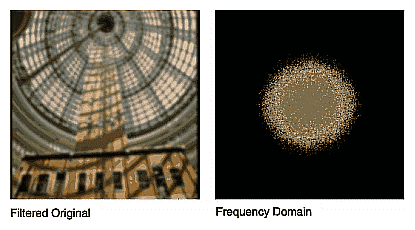
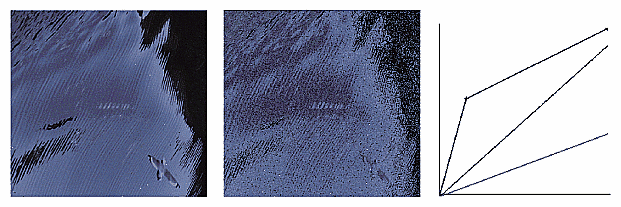
The frequency domain transformations are of limited interest as illustrations. For the purposes of this appendix, one example is shown. In the example, an original image is presented along with its appearance in the frequency, or Fourier domain, and the filtered resultant image is shown in both the spatial and frequency domains.

Figure H-22. ilFGaussFiltImg

Figure H-22 ilFGaussFiltImg

Radiometric Transformations

Figure H-23. ilHistEqImg (filtered image and histogram)

Figure H-23 ilHistEqImg (filtered image and histogram)

Figure H-24. ilHistNormImg (filtered image and histogram)

Figure H-24 ilHistNormImg (filtered image and histogram)

Figure H-25. ilHistScaleImg (filtered image and histogram)

Figure H-25 ilHistScaleImg (filtered image and histogram)

Figure H-26. ilLutImg (original, filtered image, and LUT editor)

Figure H-26 ilLutImg (original, filtered image, and LUT editor)

Figure H-27. ilThreshImg

Figure H-27 ilThreshImg

Combining Images

Figure H-28. Originals and Original Mask

Figure H-28 Originals and Original Mask

Figure H-29. ilBlendImg

Figure H-29 ilBlendImg

Figure H-30. ilCombineImg

Figure H-30 ilCombineImg