Performance Co-Pilot (PCP) has been developed to be fully extensible. The following sections summarize the various facilities provided to allow you to extend and customize PCP for your site:
“PMDA Customization”, describes the procedure for customizing the summary PMDA to export derived metrics formed by aggregation of base PCP metrics from one or more collector hosts.
“PCP Tool Customization”, describes the various options available for customizing and extending the basic PCP tools.
“PMNS Management”, covers the concepts and tools provided for updating the PMNS (Performance Metrics Name Space).
“PMDA Development”, details where to find further information to assist in the development of new PMDAs to extend the range of performance metrics available through the PCP infrastructure.
“PCP Tool Development”, outlines how new tools may be developed to process performance data from the PCP infrastructure.
The generic procedures for installing and activating the optional PMDAs have been described in “Installing and Removing PMDAs” in Chapter 2. In some cases, these procedures prompt the user for information based upon the local system or network configuration, application deployment, or processing profile to customize the PMDA and hence the performance metrics it exports.
Performance Co-Pilot (PCP) has been designed and implemented with a philosophy that embraces the notion of toolkits and encourages extensibility.
In most cases, the PCP tools provide orthogonal services, based on external configuration files. It is the creation of new and modified configuration files that enables PCP users to customize tools quickly and meet the needs of the local environment, in many cases allowing personal preferences to be established for individual users on the same PCP monitor system.
The material in this section is intended to act as a checklist of pointers to detailed documentation found elsewhere in this guide, in the man pages, and in the files that are made available as part of the PCP installation.
The PCP archive logger is presented in Chapter 6, “Archive Logging”, and documented in the pmlogger(1) man page.
The following resources are available to aid customizing of pmlogger:
| /etc/config/pmlogger | ||
Enable/disable state for the primary logger facility using this command:
| ||
| /etc/config/pmlogger.options | ||
Command line options passed to the primary logger if it is launched from /etc/init.d/pcp. | ||
| /var/pcp/config/pmlogger/config.default | ||
The default pmlogger configuration file that is used for the primary logger when this facility is enabled. | ||
| /var/pcp/config/pmlogger/config.view.* | ||
Every pmchart view also provides a pmlogger configuration file that includes each of the performance metrics used in the view, for example, /var/pcp/config/pmlogger/config.LoadAvg for the LoadAvg view. | ||
| /var/pcp/config/pmlogger/config.* | ||
Every PCP tool with a fixed group of performance metrics contributes a pmlogger configuration file that includes each of the performance metrics used in the tool, for example, /var/pcp/config/pmlogger/config.dkvis for dkvis. | ||
| /var/pcp/config/pmlogger/control | ||
Defines which PCP collector hosts require pmlogger to be launched on the local host, where the configuration file comes from, where the archive log files should be created, and pmlogger startup options. | ||
| /var/pcp/config/pmlogger/crontab | ||
Prototype crontab entries that may be merged with the crontab entries for root to schedule the periodic execution of the archive log management scripts, for example, pmlogger_daily. | ||
| /var/adm/pcplog/somehost | ||
The default behavior of the archive log management scripts create archive log files for the host somehost in this directory. | ||
| /var/adm/pcplog/somehost/Latest | ||
A PCP archive folio for the most recent archive for the host somehost. This folio is created and maintained by the cron-driven periodic archive log management scripts, for example, pmlogger_check. Archive folios may be processed with the pmafm tool. | ||
The PCP inference engine is presented in Chapter 5, “Performance Metrics Inference Engine”, and documented in the pmie(1) man page.
The following resources are available to aid customizing pmie:
| /etc/config/pmie | ||
Controls the pmie daemon facility. Enable using this command:
| ||
| /var/pcp/config/pmie/config.default | ||
The pmie configuration file that is used for monitoring the local host when the pmie daemon facility is enabled in the default configuration. This file is created using pmieconf the first time the daemon facility is activated. | ||
| /var/pcp/config/pmieconf/*/* | ||
Each pmieconf rule definition can be found below one of these subdirectories. | ||
| /var/pcp/config/pmie/control | ||
Defines which PCP collector hosts require a daemon pmie to be launched on the local host, where the configuration file comes from, where the pmie log file should be created, and pmie startup options. | ||
| /var/pcp/config/pmlogger/crontab | ||
Prototype crontab entries that may be merged with the crontab entries for root to schedule the periodic execution of the pmie_check script, for verifying that pmie instances are running. | ||
| /var/adm/pmielog/ | ||
The default behavior of the /etc/init.d/pmie startup scripts create pmie log files for the host in this directory. | ||
The PMCD PMDA exports information about executing pmie instances and their progress in terms of rule evaluations and action execution rates.
| pmie_check | This command is similar to the pmlogger support script, pmlogger_check. | |
| /etc/init.d/pmie | This control file supports the starting and stopping of multiple pmie instances that are monitoring one or more hosts. | |
| /var/tmp/pmie | The statistics that pmie gathers are maintained in binary data structure files. These files are in the /var/tmp/pmie directory. | |
| pmcd.pmie metrics | If pmie is running on a system with a PCP collector deployment, the pmcd PMDA exports these metrics via the pmcd.pmie group of metrics. |
This section describes the syntax, semantics, and processing framework for the external specification of a Performance Metrics Name Space (PMNS) as it might be loaded by the PMAPI routine pmLoadNameSpace; see the pmLoadNameSpace(3) man page.
The PMNS specification is a simple ASCII source file that can be edited easily. For reasons of efficiency, a binary format is also supported; the utility pmnscomp translates the ASCII source format into binary format; see the pmnscomp(1) man page.
The PMNS specification is initially passed through cpp. This means the following facilities may be used in the specification:
C-style comments
#include directives
#define directives and macro substitution
Conditional processing with #if, #endif, and so on
When cpp is executed, the standard include directories are the current directory and /var/pcp/pmns, where some standard macros and default specifications may be found.
Every PMNS is tree structured. The paths to the leaf nodes are the performance metric names. The general syntax for a non-leaf node in PMNS is as follows:
pathname {
name	[pmid]
...
} |
Here pathname is the full pathname from the root of the PMNS to this non-leaf node, with each component in the path separated by a period. The root node for the PMNS has the special name root, but the prefix string root. must be omitted from all other pathnames.
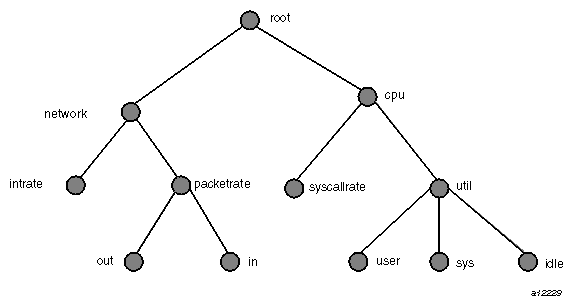
For example, refer to the PMNS shown in Figure 8-1. The correct pathname for the rightmost non-leaf node is cpu.util, not root.cpu.util.
Each component in the pathname must begin with an alphabetic character and be followed by zero or more alphanumeric characters or the underscore (_) character. For alphabetic characters in a component, uppercase and lowercase are significant.
Non-leaf nodes in the PMNS may be defined in any order desired. The descendent nodes are defined by the set of names, relative to the pathname of their parent non-leaf node. For descendent nodes, leaf nodes have a pmid specification, but non-leaf nodes do not.
The syntax for the pmid specification was chosen to help manage the allocation of Performance Metric IDs (PMIDs) across disjoint and autonomous domains of administration and implementation. Each pmid consists of three integers separated by colons, for example, 14:27:11. This is intended to mirror the implementation hierarchy of performance metrics. The first integer identifies the domain in which the performance metric lies. Within a domain, related metrics are often grouped into clusters. The second integer identifies the cluster, and the third integer, the metric within the cluster.
The PMNS specification for Figure 8-1 is shown in Example 8-1:
Example 8-1. PMNS Specification
/*
* PMNS Specification
*/
#include <stdpmid>
root {
       network
       cpu
}
#define NETWORK 26
network {
       intrate    `IRIX:NETWORK:1
       packetrate
}
network.packetrate {
       in     IRIX:NETWORK:35
       out    IRIX:NETWORK:36
}
#define CPU 10
cpu {
       syscallrate    IRIX:CPU:10
       util
}
#define USER 20
#define KERNEL 21
#define IDLE 22
cpu.util {
       user    IRIX:CPU:USER
       sys     IRIX:CPU:KERNEL
       idle    IRIX:CPU:IDLE
} |
For complete documentation of the PMNS and associated utilities, see the pmns(4), pmnscomp(1), pmnsadd(1), pmnsdel(1), and pmnsmerge(1) man pages.
Performance Co-Pilot (PCP) is designed to be extensible at the collector site.
Application developers are encouraged to create new PMDAs to export performance metrics from the applications and service layers that are particularly relevant to a specific site, application suite, or processing environment.
These PMDAs use the routines of the libpcp_pmda library, which is discussed in detail by the Performance Co-Pilot Programmer's Guide.
Performance Co-Pilot (PCP) is designed to be extensible at the monitor site.
Application developers are encouraged to create new PCP client applications to monitor or display performance metrics in a manner that is particularly relevant to a specific site, application suite, or processing environment.
Client applications use the routines of the PMAPI (performance metrics application programming interface) described in the Performance Co-Pilot Programmer's Guide.