Performance Co-Pilot (PCP) is a coordinated suite of tools and utilities allowing you to monitor performance and make automated judgments and initiate actions based on those judgments. PCP is designed to be fully configurable for custom implementation and deployed to meet specific needs in a variety of operational environments.
Because each enterprise and site is different and PCP represents a new way of visualizing performance information, some discussion of deployment strategies is useful.
The most common use of performance monitoring utilities is a scenario where the PCP tools are executed on a workstation (the PCP monitoring system), while the interesting performance data is collected on remote systems (PCP collector systems) by a number of processes, specifically the Performance Metrics Collection Daemon (PMCD) and the associated Performance Metrics Domain Agents (PMDAs). These processes can execute on both the monitoring system and one or more collector systems, or only on collector systems. However, collector systems are the real objects of performance investigations.
The material in this chapter covers the following areas:
“Basic Deployment”, presents the spectrum of deployment architectures at the highest level.
“PCP Collector Deployment”, describes alternative deployments for PMCD and the PMDAs.
“PCP Archive Logger Deployment”, covers alternative deployments for the pmlogger tool.
“PCP Inference Engine Deployment”, presents the options that are available for deploying the pmie tool.
The options shown in this chapter are merely suggestions. They are not comprehensive, and are intended to demonstrate some possible ways of deploying the PCP tools for specific network topologies and purposes. You are encouraged to use them as the basis for planning your own deployment, consistent with your needs.
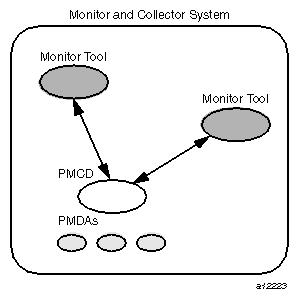
In the simplest PCP deployment, one system is configured as both a collector and a monitor, as shown in Figure 7-1. Because the PCP monitor tools make extensive use of visualization, this suggests the single system would be configured with a graphics head.
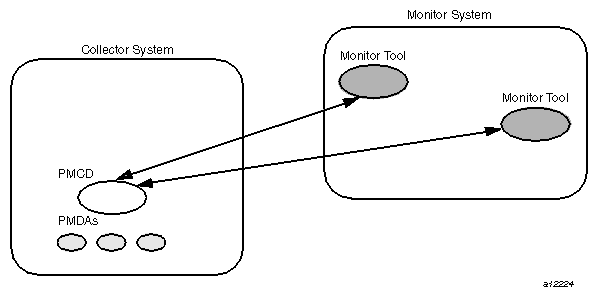
However, most PCP deployments involve at least two systems. For example, the setup shown in Figure 7-2 would be representative of many common scenarios.
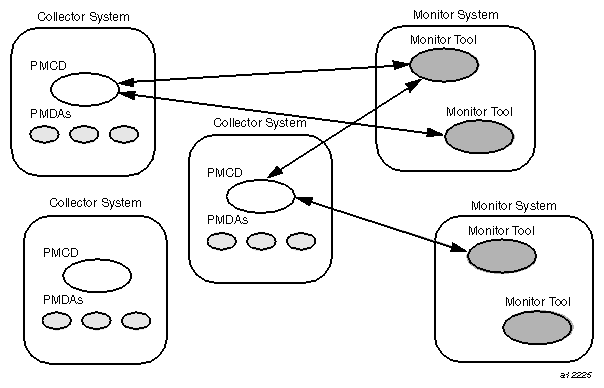
But the most common site configuration would include a mixture of systems configured as PCP collectors, as PCP monitors, and as both PCP monitors and collectors, as shown in Figure 7-3.
With one or more PCP collector systems and one or more PCP monitor systems, there are a number of decisions that need to be made regarding the deployment of PCP services across multiple hosts. For example, in Figure 7-3 there are several ways in which both the inference engine (pmie) and the PCP archive logger ( pmlogger) could be deployed. These options are discussed in the following sections of this chapter.
Each PCP collector system must have an active pmcd and, typically, a number of PMDAs installed.
The first hosts selected as PCP collector systems are likely to provide some class of service deemed to be critical to the information processing activities of the enterprise. These hosts include the following:
A server running a DBMS
A World Wide Web server for an Internet or Intranet
An NFS file server
A video server
A supercomputing server
An infrastructure service provider, for example, print, Usenet news, DNS, gateway, firewall, packet router, or mail services
A system running a mission-critical application
Your objective may be to improve quality of service on a system functioning as a server for many clients. You wish to identify and repair critical performance bottlenecks and deficiencies in order to maintain maximum performance for clients of the server.
For some of these services, the PCP base product or the PCP add-on products provide the necessary collector components. Others would require customized PMDA development, as described in the companion Performance Co-Pilot Programmer's Guide.
Applications and services with a client-server architecture need to monitor performance at both the server side and the client side.
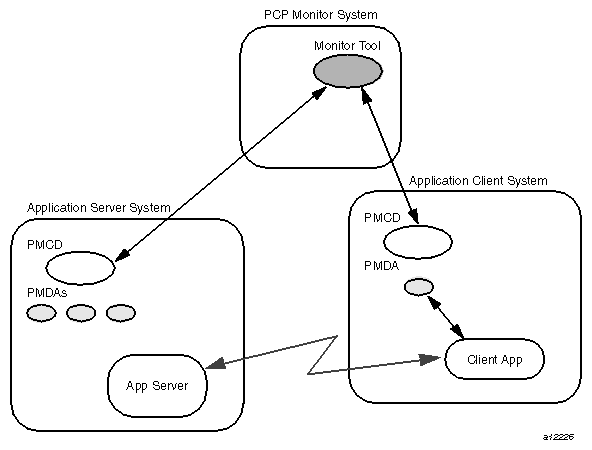
The arrangement in Figure 7-4 illustrates one way of measuring quality of service for client-server applications.
The configuration of the PCP collector components on the Application Server System is standard. The new facility is the deployment of some PCP collector components on the Application Client System; this uses a customized PMDA and a generalization of the ICMP “ping” tool as follows:
The Client App is specially developed to periodically make typical requests of the App Server, and to measure the response time for these requests (this is an application-specific “ping”).
The PMDA on the Application Client System captures the response time measurements from the Client App and exports these into the PCP framework.
At the PCP monitor system, the performance of the system running the App Server and the end-user quality of service measurements from the system where the Client App is running can be monitored concurrently.
PCP add-on products implement a number of examples of this architecture, including the shping PMDA for IP-based services and the webping PMDA for Web servers.
For each of these PMDAs, the full source code is distributed with the associated PCP product to encourage adaptation of the agents to the local application environment.
It is possible to exploit this arrangement even further, with these methods:
Creating new instances of the Client App and PMDA to measure service quality for your own mission-critical services.
Deploying the Client App and associated PCP collector components in a number of strategic hosts allows the quality of service over the enterprise's network to be monitored. For example, service can be monitored on the Application Server System, on the same LAN segment as the Application Server System, on the other side of a firewall system, or out in the WAN.
PCP archive logs are created by the pmlogger utility, as discussed in Chapter 6, “Archive Logging”. They provide a critical capability to perform retrospective performance analysis, for example, to detect performance regressions, for problem analysis, or to support capacity planning. The following sections discuss the options and trade-offs for pmlogger deployment.
The issue is relatively simple and reduces to “On which host(s) should pmlogger be running?” The options are these:
Run pmlogger on each PCP collector system to capture local performance data.
Run pmlogger on some of the PCP monitor systems to capture performance data from remote PCP collector systems.
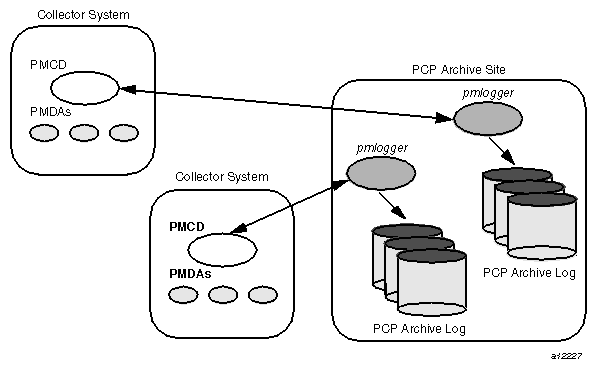
As an extension of the previous option, designate one system to act as the PCP archive site to run all pmlogger instances. This arrangement is shown in Figure 7-5.
The pmlogger process is very lightweight in terms of computational demand; so most of the (small) CPU cost associated with extracting performance metrics at the PCP collector system involves PMCD and the PMDAs, which are independent of the host on which pmlogger is running.
A local pmlogger consumes disk bandwidth and disk space on the PCP collector system. A remote pmlogger consumes disk space on the site where it is running and network bandwidth between that host and the PCP collector host.
The archive logs typically grow at the rate of between 500 kilobytes (KB) and 10 megabytes (MB) per day, depending on how many performance metrics are logged and the choice of sampling frequencies. There are some advantages in minimizing the number of hosts over which the disk resources for PCP archive logs must be allocated; however, the aggregate requirement is independent of where the pmlogger instances are running.
There is an initial administrative cost associated with configuring each pmlogger instance, and an ongoing administrative investment to monitor these configurations, perform regular housekeeping (such as rotation, compression, and culling of PCP archive log files), and execute periodic tasks to process the archives (such as nightly performance regression checking with pmie, or using pmchart to publish recent activity charts on the Web).
Many of these tasks are handled by the supplied pmlogger administrative tools and scripts, as described in “Archive Log File Management” in Chapter 6. However, the necessity and importance of these tasks favor a centralized pmlogger deployment, as shown in Figure 7-5.
| Note: The pmlogger utility is not subject to any PCP license restrictions, and may be installed and used on any host. |
Collecting PCP archive logs is of little value unless the logs are processed as part of the ongoing performance monitoring and management functions. This processing typically involves the use of the tools on a PCP monitor system, and hence the archive logs may need to be read on a host different from the one they were created on.
NFS mounting is obviously an option, but the PCP tools support random access and both forward and backward temporal motion within an archive log. If an archive is to be subjected to intensive and interactive processing, it may be more efficient to copy the files of the archive log to the PCP monitor system first.
| Note: Each PCP archive log consists of at least three separate files (see “Archive Log File Management” in Chapter 6 for details). You must have concurrent access to all of these files before a PCP tool is able to process an archive log correctly. |
The pmie utility supports automated reasoning about system performance, as discussed in Chapter 5, “Performance Metrics Inference Engine”, and plays a key role in monitoring system performance for both real-time and retrospective analysis, with the performance data being retrieved respectively from a PCP collector system and a PCP archive log.
The following sections discuss the options and trade-offs for pmie deployment.
The issue is relatively simple and reduces to “On which host(s) should pmie be running?” You must consider both real-time and retrospective uses, and the options are as follows:
For real-time analysis, run pmie on each PCP collector system to monitor local system performance.
For real-time analysis, run pmie on some of the PCP monitor systems to monitor the performance of remote PCP collector systems.
For retrospective analysis, run pmie on the systems where the PCP archive logs reside. The problem then reduces to pmlogger deployment as discussed in “PCP Archive Logger Deployment”.
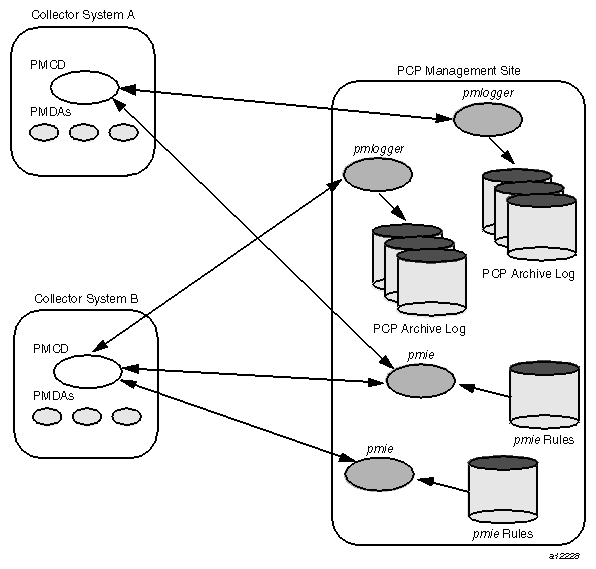
As an example of the “distributed management with centralized control” philosophy, designate some system to act as the PCP Management Site to run all pmlogger and pmie instances. This arrangement is shown in Figure 7-6.
One pmie instance is capable of monitoring multiple PCP collector systems; for example, to evaluate some universal rules that apply to all hosts. At the same time a single PCP collector system may be monitored by multiple pmie instances; for example, for site-specific and universal rule evaluation, or to support both tactical performance management (operations) and strategic performance management (capacity planning). Both situations are depicted in Figure 7-6.
Depending on the complexity of the rule sets, the number of hosts being monitored, and the evaluation frequency, pmie may consume CPU cycles significantly above the resources required to simply fetch the values of the performance metrics. If this becomes significant, then real-time deployment of pmie away from the PCP collector systems should be considered in order to avoid the “you're part of the problem, not the solution” scenario in terms of CPU utilization on a heavily loaded server.
An initial administrative cost is associated with configuring each pmie instance, particularly in the development of the rule sets that accurately capture and classify “good” versus “bad” performance in your environment. These rule sets almost always involve some site-specific knowledge, particularly in respect to the “normal” levels of activity and resource consumption. The pmieconf tool (see “Creating pmie Rules with pmieconf” in Chapter 5) may be used to help develop localized rules based upon parameterized templates covering many common performance scenarios. In complex environments, customizing these rules may occur over an extended period and require considerable performance analysis insight.
One of the functions of pmie provides for continual detection of adverse performance and the automatic generation of alarms (visible, audible, e-mail, pager, and so on). Uncontrolled deployment of this alarm initiating capability throughout the enterprise may cause havoc.
These considerations favor a centralized pmie deployment at a small number of PCP monitor sites, or in a PCP Management Site as shown in Figure 7-6.
However, it is most likely that knowledgeable users with specific needs may find a local deployment of pmie most useful to track some particular class of service difficulty or resource utilization. In these cases, the alarm propagation is unlikely to be required or is confined to the system on which pmie is running.
Configuration and management of a number of pmie instances is made much easier with the scripts and control files described in “Management of pmie Processes” in Chapter 5.
