The SGI product line ranges from desktop workstations to supercomputers, which makes it one of the broadest product lines in the industry. Supporting such a diverse product line creates many challenges.
Embedded Support Partner (ESP) was created to address some of these challenges by automatically detecting system conditions that indicate potential future problems and notifying the appropriate personnel. This enables SGI customers and support personnel to proactively support systems and resolve issues before they develop into actual failures.
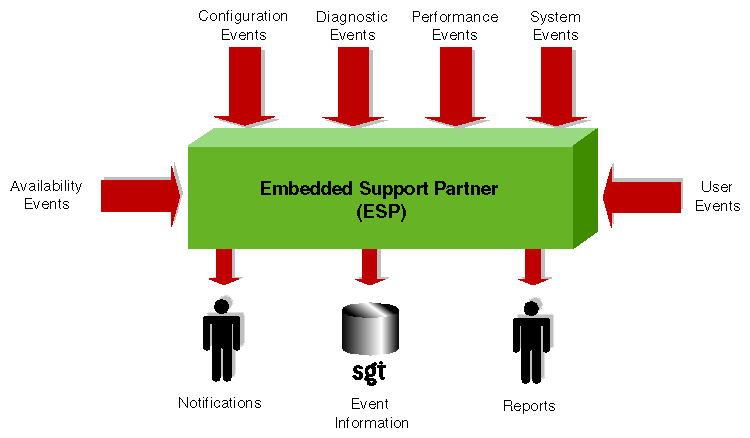
ESP integrates monitoring, notifying, and reporting operations. It enables users to monitor one or more systems at a site from a local or remote connection. ESP provides the following functions:
Monitoring system configuration, events, performance, availability, and services
Providing proactive notification when specific conditions occur
Generating reports about system activity (configuration changes, events, availability, etc.)
Sending event information to SGI for statistical interpretation
Providing usability enhancements (common interface, remote support, and system group management)
Figure 1-1 provides a functional diagram of ESP.
This document describes ESP version 2.0, which is included in a patch that applies to IRIX 6.5.7 and IRIX 6.5.8 and is included in IRIX 6.5.9 and higher. (ESP automatically updates to version 2.0, if necessary.)
The ESP software is distributed in two levels:
Base package
Extended package
The base package includes the single system manager, which has the functionality necessary to:
Configure ESP
Monitor a single system for system and performance events, configuration changes, and availability
Notify support personnel when specific events occur
Generate basic reports
The features in the base package are included in the IRIX 6.5.5 and later releases at no extra cost. They are installed by default, and ESP begins monitoring the system as soon as the system is booted (if ESP is chkconfig'ed on). You can configure the base package to specify what types of events it should monitor and whom it should notify when events occur.
| Note: ESP can also monitor events from diagnostic tests and perform actions based on these events. To use these optional features, install the diagnostics from the Internal Support Tools 2.0 CD or a later release. The Internal Support Tools CDs are available only to SGI personnel. |
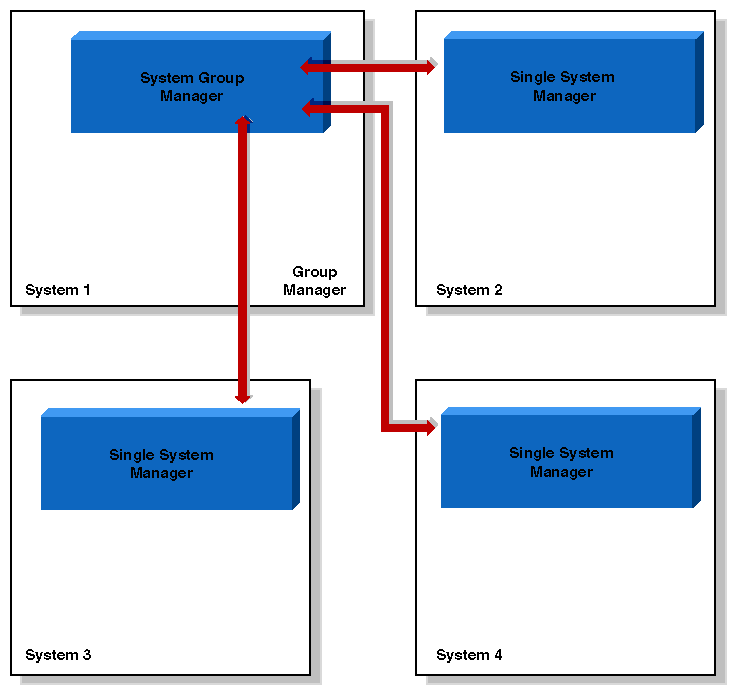
The extended package includes the System Group Manager (SGM), which adds the capabilities to monitor multiple systems at a site. The system selected as the group manager runs the SGM, which manages all systems in the group.
The SGM provides functionality to uniformly manage multiple systems when more than one system is installed at a site. Specifically, it performs the following functions:
System group event tracking
System group configuration management
System group availability monitoring
Notification (based on the events that occur on systems in the group)
Enhanced reporting for groups of systems, including:
Availability metrics (MTBI, availability, etc.) at a site level and individual system level
Site event reports
Any system within a system group can be designated the group manager (it is even possible to have more than one group manager). A system that is designated as the group manager monitors all systems in the group, including itself.
The features in the extended package are also included in the IRIX 6.5.5 and later releases, but these features are not enabled unless the customer acquires a license to use them. (A 90-day free trial license is included; full licenses are included in some service contracts or may be purchased separately.)
Figure 1-2 provides a block diagram of system group management.
Table 1-1 lists the benefits that ESP provides for service personnel and customers.
Component | Feature | Benefit to Service Provider | Benefit to Customer |
|---|---|---|---|
Base Package (Single System Manager) | Single Web-based interface | Increases usability of support tools on a single system | Provides fast and effective service |
| Broad and useful support functionality | Provides an integrated set of tools that work in a single framework while increasing support coverage | Provides consistent and wide coverage on systems |
| Centralized event processing (single system) | Enables you to collect and display all information from one central location | Provides the entire set of circumstances in one place |
| Centralized automated response and notification (single system) | Provides visibility to problems as they occur | Enables proactive support Provides a quick insight to problems |
| Remote support | Provides a virtual seat into the site remotely | Provides an effective means of delivering service (which greatly increases system availability with accurate problem diagnosis) |
Extended Package (System Group Manager) | Centralized event processing (group management) | Enables you to collect and display all information from one central location (which helps to determine causes of problems on systems within the site) | Provides the entire set of circumstances in one place |
| Centralized support administration (group management) | Provides a single location from which all support activities can be performed for a group of systems | Eases administration and service tracking |
| Centralized automated response and notification (group management) | Provides visibility to problems as they occur | Provides proactive support Provides a quick insight to problems |
| Centralized site reporting | Provides accurate system and site data online | Enables extensive tracking of availability and system performance |
| Centralized troubleshooting | Provides the ability to resolve problems from a central location | Provides an efficient mechanism to fix problems on-site |
| Extensible rule evaluation mechanism | Provides an easy method to add site- or system-specific rules to the default set | Enables use of additional software products to extend the range of monitored subsystems (for example, Cisco routers and Web servers) |
| Local or remote service failure detection and quality-of-service monitoring | Automates detection of failed services for proactive support | Increases service availability and quality by automating service probing and checking |
ESP is a modular system. Each module works independently on a specific function, and no functional overlap exists between the various modules. Some modules run as daemons and others run as stand-alone applications that are driven by events.
The daemon components of ESP are:
Core software
System Support Database (SSDB): espdbd
System Event Manager (SEM): eventmond
Monitoring software
Event monitor subsystem: eventmond
The stand-alone components of ESP are:
Monitoring software
Availability monitor: availmon
Configuration monitor: configmon
Notification software
espnotify
espcall
Console software
Configurable Web server: esphttpd
Web-based interface
Report generator core
Report generator plugins
Command line interface
Configuration tool: espconfig
Report tool: espreport
If you install the performance metrics inference engine application, pmie, which is included in the Performance Co-Pilot Execution Only Environment (pcp_eoe subsystem), ESP can receive notification of resource oversubscription, bandwidth saturation, and other adverse performance conditions.
If you install the Internal Support Tools 2.0 CD or a later release, ESP can receive data from the diagnostic tools included on the CD.)
| Note: The Internal Support Tools CDs are available only to SGI support personnel (for example, System Support Engineers). |
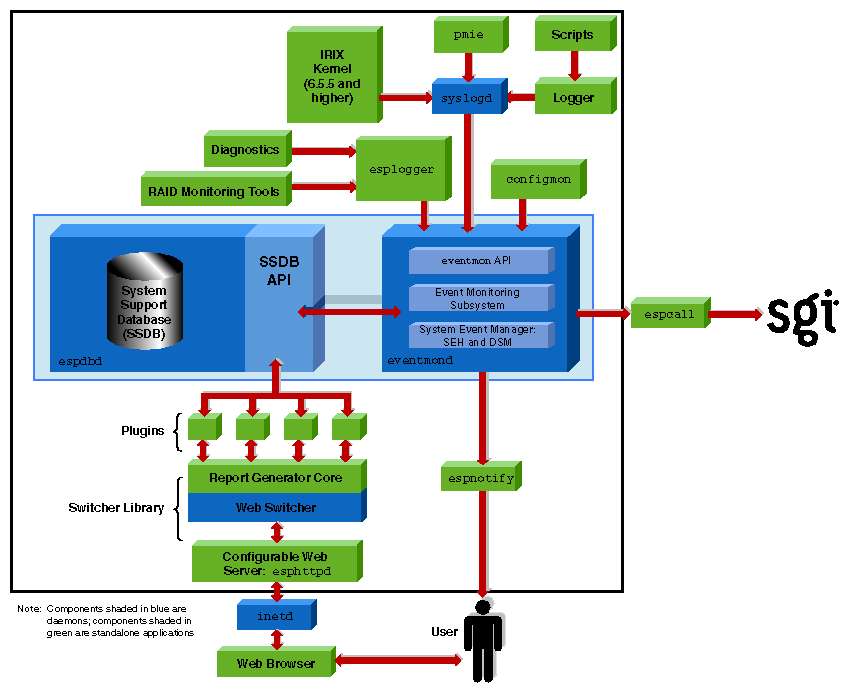
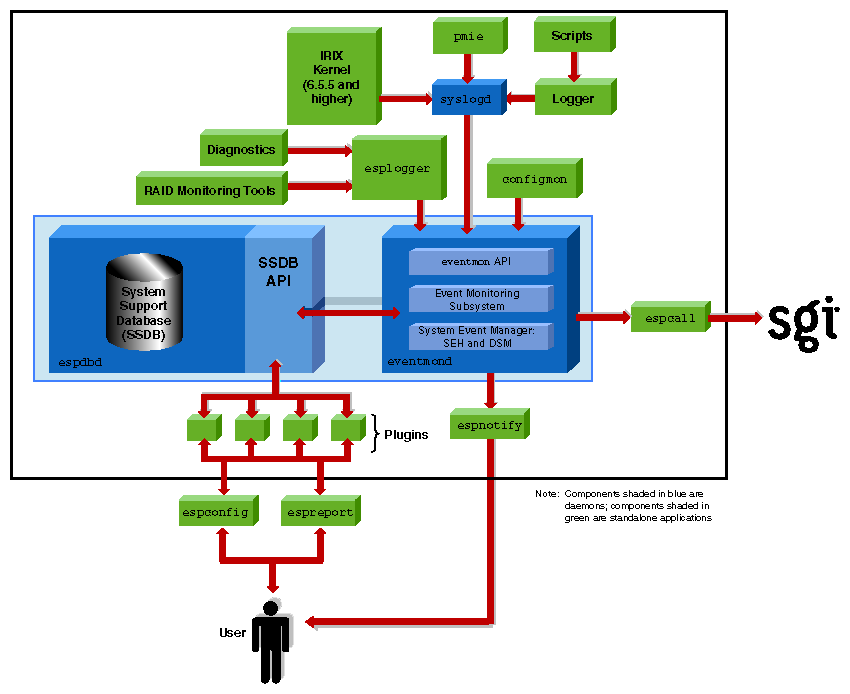
Figure 1-3 shows the ESP architecture when a Web-based interface is used. Figure 1-4 shows the ESP architecture when a command line interface is used. Descriptions of the components follow the figures.(Components shaded in blue are daemons; components shaded in green are standalone applications.)
The core software includes the functionality that is necessary to process events, to determine the action to perform, and to store data about the system that ESP is monitoring.
The core software includes the following components:
System Support Database (SSDB)
System Event Manager (SEM)
The SSDB is the central repository for all system support data. It contains the following data types:
System configuration data
System event data
System actions for system events
System availability data
Diagnostic test data
Task configuration data
The SSDB includes a server that runs as a daemon, espdbd, which starts at boot time.
| Note: ESP includes a utility (esparchive) that you can use to archive the current SSDB data, which reduces the amount of disk space that is used. |
The SEM, which runs as threads of the eventmond daemon, is the control center of ESP. It includes the following components:
A system event handler (SEH)
A decision support module (DSM)
The SEH logs events into the SSDB (after validating and throttling/filtering) and passes the events to the DSM for processing.
The DSM is a rules-based event management subsystem. The main tasks of the DSM are:
Parsing rule(s) for an event
Initiating any necessary action(s) for an event
Logging the actions that were performed in the SSDB
The DSM receives events from the SEH and then applies user-configurable rules to each event. If necessary, the DSM executes any actions that are assigned to the events.
A key function of ESP is monitoring the system. The ESP base package includes software that enables the following types of monitoring on a system:
Configuration monitoring (with the configmon tool)
Event monitoring (with the eventmond daemon)
Availability monitoring (with the availmon tool)
Monitoring is performed by tools that run as stand-alone programs and communicate with the ESP control software.
| Note: Performance monitoring is available through the pmie application, which is included in the Performance Co-Pilot Execution Only Environment (pcp_eoe subsystem). Refer to “Performance Monitoring Tools” for more information. |
The base package includes a configuration monitoring application, configmon. The configmon application monitors the system configuration by performing the following functions when configuration events occur:
It determines the current software and hardware configuration of a system, gathering as much detail as possible (for example, serial numbers, board revision levels, installed software products, installed patches, installation dates, etc.).
It verifies that the configuration data in the SSDB is up-to-date by comparing the current system configuration data with the configuration data in the SSDB.
It updates the SSDB so that it is current (with information about the hardware or software that has changed).
It provides data for various system configuration reports that the system administrator or field support personnel can use.
The configmon application runs at system start-up to gather updated configuration information.
ESP is an event-driven system. Events can come from various sources. Examples of events are:
Configuration events
Inferred performance events
Availability events
System critical events (from the kernel and various device drivers)
Diagnostic events
The ESP base package includes an event monitoring subsystem to monitor important system events that are logged into syslogd by the kernel, drivers, and other system components. This subsystem is part of the eventmond daemon, which starts at boot time immediately after the syslogd daemon starts.
All events pass to the event monitoring subsystem from one of the following paths:
syslogd
esplogger
eventmon API
The eventmond daemon monitors events from syslogd, and the eventmon API and uses the SEM to log the events in the SSDB. syslogd performs some event throttling/filtering. You can configure ESP to do more extensive event throttling/filtering, which reduces system resource overhead when syslogd logs a large number of duplicate events because of an error condition.
If the SSDB server is not running when eventmond attempts to log events, eventmond buffers the events until it can successfully log the events.
The eventmon API provides the mechanism that enables tasks to communicate with eventmond. The eventmond daemon receives information from external monitoring tasks through API function calls that the tasks send or that esplogger sends to eventmond. Each command that is sent to eventmond returns a status code that indicates successful completion or the reason that a failure occurred.
The base package also includes an availability monitoring application, availmon. The availmon application monitors machine uptime and differentiates between controlled shutdowns, system panics, power cycles, and power failures.
Availability monitoring is useful for high-availability systems, production systems, or other customer sites where monitoring availability information is important.
The availmon application runs at system start-up to gather the availability data.
Notification is one of the actions that can be programmed to take place when a particular system event occurs. The notification software provides several types of notifiers, including dialog boxes on the local system, e-mail, paging, and diagnostic reports and other types of reports.
The espnotify tool provides the following notification capabilities for ESP:
E-mail notifications
GUI-based or console text notifications (with audio if the notification is on the local host)
Program execution for notification
Alphanumeric and chatty paging through the Qpage application
Typically, the Decision Support Module (DSM) invokes the espnotify tool in response to some event. However, you can run the espnotify tool as a stand-alone application, if necessary.
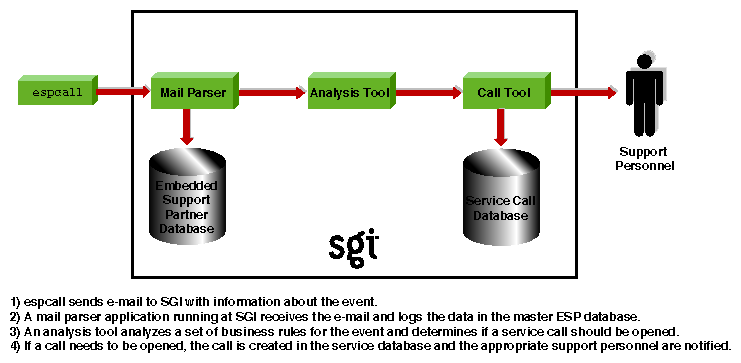
The espcall tool sends event information from a system to the main ESP database at SGI. Figure 1-5 shows how this information is processed.
SGI uses the event information to provide faster and more accurate responses to potential system problems. (Any customer can send event information to SGI; however, service calls are automatically opened only for customers whose service contracts include this option.)
The following example message, which was generated by espcall, shows the type of information that is returned to SGI for an availability event:
Subject: [maui]: System Information maui.sgi.com 1015961831,1015961831,1015357057,0,7 ,NULL,NULL,NULL,NULL,NULL,NULL,0,0,NULL,NULL 03/12/2002 11:37:11 Availability 4000 Status report 2097158 21 B0006011 |
The ESP base package includes console software that enables you to interact with it from a Web browser. The console software uses the Configurable Web Server (esphttpd) to receive input from the user, send it to the ESP software running on the system, and return the results to the user. (inetd invokes esphttpd whenever a Web server connection is needed.)
The console software also includes a report generator core and a set of plugins to create various types of reports. These reports are based on the data that ESP tasks provide, such as configmon, availmon, etc.
In the base package, you can access the following types of reports:
System, hardware, and software configuration reports (current and historical)
System event reports
Event action reports
Local system metrics (MTBI, availability, etc.)
ESP configuration
The extended package enables you to generate enhanced site-level reports and reports for any system on the site.
If you use a graphical Web browser (for example, Netscape Communicator) to access the Web server, the console software provides a graphical Web-based interface that supports the following functionality:
Configuring the behavior of ESP
Configuring the Web server
Configuring system groups
Configuring the behavior of tasks
Setting up monitors and associated thresholds
Setting up notifiers
Generating reports for a single system or group of systems
Accessing system consoles and system controllers
Remotely controlling a system with the IRISconsole multiserver management system
To access the Web-based interface, enter the launchESPpartner command or double-click on the Embedded_Support_Partner icon (which is located on the SupportTools page of the icon catalog).
If you prefer to use a command line interface, the Command Line Application (CLA) software enables you to connect to ESP without using a Web server. This enables ESP to be used at a site where the Web server cannot be used for security reasons. It also enables ESP to be used over slower remote connections because only text is transferred across the connection.
There are two components to the CLA software:
espconfig
espreport
The espconfig command enables you to configure ESP.
The espreport command enables you to generate and view reports.
| Note: You must use the root account or an account with root privileges to execute the espconfig and espreport commands. |
The following external tools can interface with the ESP framework to provide data about events that are external to ESP:
Performance monitoring tools
Diagnostic tools
RAID monitoring tools
These tools are not part of the ESP package and must be loaded separately.
The performance metrics inference engine application, pmie, which is included in the Performance Co-pilot Execution Only Environment (pcp_eoe subsystem) can interface with the ESP framework to provide ESP with performance monitoring events.
pmie is an inference engine for performance metrics: It evaluates a set of performance rules at specified time intervals. You can use a separate utility to customize and extend the rules and their attributes.
Refer to the Performance Co-Pilot IRIX Base Software Administrator's Guide, publication number 007-3964-001, for more information about pmie and the pcp_eoe subsystem.
The support tools included in the Internal Support Tools 2.0 CD and later releases can also interface with the ESP framework. If you install the Internal Support Tools 2.0 CD or a later release, ESP collects data from the diagnostic tools that are included on the CD. Refer to the CD booklet for installation instructions for the support tools.
| Note: The Internal Support Tools CDs are available only to SGI support personnel (for example, System Support Engineers). |
Starting with IRIX 6.5.17, ESP receives RAID events from the TP9100 and TP9400 disk subsystems. The following software enables ESP to receive these events:
The tpmwatch application monitors the TP9100 disks and writes RAID events to the tpmwatch log.
The tpssm7monitor (for T9400 releases 3 and 4) and tpssmmonitor (for TP9400 release 5) daemons monitor the TP9400 disks and write RAID events to the Major Event Log (MEL).
A script checks the tpmwatch log and MEL for new events and uses esplogger to send the events to ESP.
The Storage_TP9100.esp and Storage_TP9400.esp ESP event profiles specify the RAID events that ESP should register.
Remote support capability enables you to connect to the console software (with a Web browser) or directly to ESP (with the command line application) from a remote location. This capability enables you to control ESP from the remote location and provides SGI support personnel with a “virtual seat” on the system or systems on which they need to work.
Remote support capability is built into ESP. The only requirement is a communication channel (for example, a network connection) to the site.
ESP implements the following security features to prevent unauthorized access to ESP, the data that ESP stores, and the system that is running ESP:
ESP requires a login/password combination to access the Web server.
ESP validates user permissions for the accounts that are assigned to execute actions.
ESP does not permit actions to run as root.
ESP implements ReverseDNS lookup for Web server and SGM connections.
ESP uses HMAC-MD5 digital signatures for all data transfers to an SGM server.
ESP disables login attempts after four unsuccessful attempts. (Users must wait several minutes before attempting to log in again.)
ESP includes a command-line interface to enable users to use ESP without running the Web server on their system.
ESP restricts database access to local transactions (external systems cannot directly access the ESP database).
ESP limits information returned to SGI with the call-logging feature to event-specific information. (ESP does not transmit any customer proprietary information to SGI.)
ESP can encrypt the e-mail notifications that it sends.
The eventmond and espdbd daemons that ESP uses are event-driven and consume CPU resources only when events occur. When ESP receives an event, the daemons use less than 2 milliseconds of CPU time to process the event and store it in the ESP database.
The eventmond daemon uses approximately 200 KB of memory to run; the espdbd daemon uses approximately 500 KB of memory to run. Most of this memory is used to store the system configuration data, so the daemons use more memory on larger systems than they do on smaller systems.
ESP disk utilization depends on the size of the system; larger systems require more disk space than smaller systems. (For example, a 64-processor system with 75 to 125 boards uses less than 30 MB of disk space.) Once a database uses at least 10 MB of disk space, you can use the esparchive utility to compress the database to 40 to 60 percent of its original size.
