This chapter describes the Tester graphical user interface. It contains these sections:
When you run cvxcov, the main Tester window opens and an iconized version of the Execution View appears on your screen. It displays the output and status of a running program and accepts input. To open a closed Execution View, see “Clone Execution View” in “Admin Menu Operations”.
There are two methods of accessing the Tester graphical user interface:
Type cvxcov at the command line with these optional arguments: -testname test to load the test; -ver to show the Tester release version; and -scheme schemename to set a predefined color scheme.
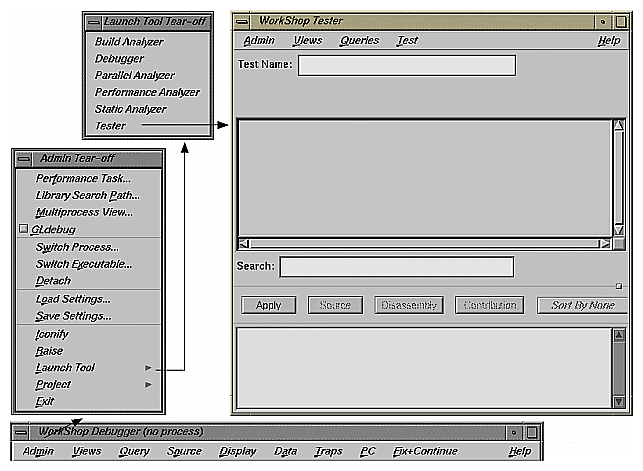
Select Tester from the Launch Tool submenu in a WorkShop Admin menu (see Figure 5-1). The major WorkShop tools, the Debugger, Static Analyzer, and Build Manager provide Admin menus from which you can access Tester.
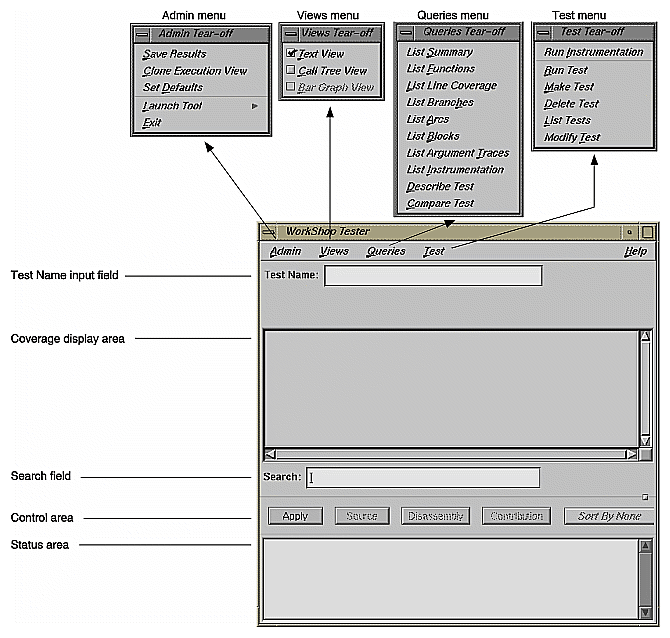
The main window and its menus are shown in Figure 5-2.
The current test is entered (and displayed) in the Test Name field. You can switch to a different test, test set, or test group through this field. To the right, the Type field indicates whether it is a Single Test, Test Set, or Test Group. You can select a test (test set or test group) from the List Tests dialog box under the Test menu, to appear in the Test Name field in the main window.
Test results display in the coverage display area. You select the results by choosing an item from the Queries menu. You can select the format of the data--text, call tree, or bar chart-- from the Views menu. (Note that the Text View format is available for all queries, whereas the other two views are limited.)
The Query Type displays under the Test Name field, just over the display. It is followed on the far right of the window by the Query Size (number of items in the list). Headings above the display are specific to each query.
The Search field lets you look for strings in the coverage data. It uses an incremental search, that is, as you enter characters, the highlight moves to the first matching target. When you press the Return key, the highlight moves to the next occurrence.
The Apply button is a general-purpose button for terminating data entry in text fields; you can use the Return key equivalently. Both start the query.
The Source button lets you bring up the standard Source View window with Tester annotations. Source View shows the counts for each line and highlights lines with 0 counts. By default, Source View is shared with other applications. For example, if cvstatic performs a search for function A, the results of the query overwrite Tester query results that are in the shared Source View. To stop sharing Source View with other applications, set the following resource:
cvsourceNoShare: True |
The Disassembly button brings up the Disassembly View window, called Assembly Source Coverage, which operates at the machine level in a similar fashion to the Source View. This view is not shared with other applications.
The Contribution button brings up the Test Contribution window with the contributions made by each test so that you can compare the results. It is available for the queries List Functions, List Arcs, and List Blocks. When the tests do not fit on one page, multiple pages are used. Use the Previous Page and Next Page buttons to display all the tests.
The Sort button lets you sort the test results by criteria such as function, count, file, type, difference, caller, or callee. The criteria available depend on the current query.
The status area displays status messages that confirm commands, issue warnings, and indicate error conditions. When you enter a test name in the Test Name field, the Func Name field appears (along with other items) in the status area for use with queries. Entering a function in this field displays the coverage results limited to that function only.
Additional items display in the area below the status area that change when you select commands from the Queries menu. These items are specific to the query selected. Some of these items can be used as defaults (see “Queries Menu Operations”).
The Admin menu lets you perform general housekeeping concerning saving files, setting defaults, changing directories, launching other WorkShop applications, and exiting.
The Test menu lets you create, modify, and run tests, test sets, and test groups.
The Views menu lets you choose one of the following modes:
Text mode, which displays results numerically in columns
Graphical mode, which displays the following:
Functions as nodes (rectangles) annotated by results
Calls as arcs (connecting arrows)
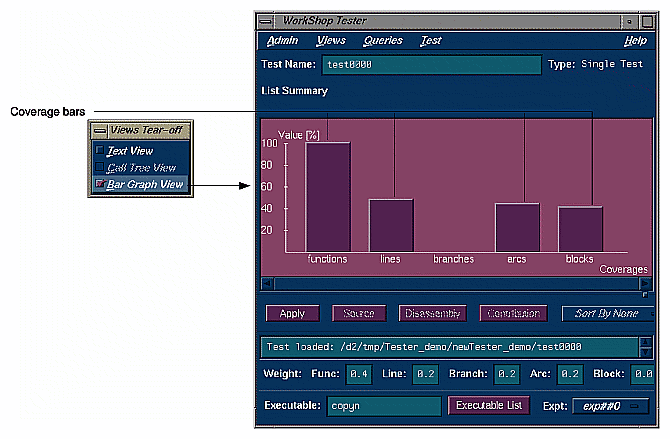
Bar graph mode, which displays the summary of a test as a bar graph.
The Queries menu lets you analyze the results of tests. The Help menu is standard in all tools.
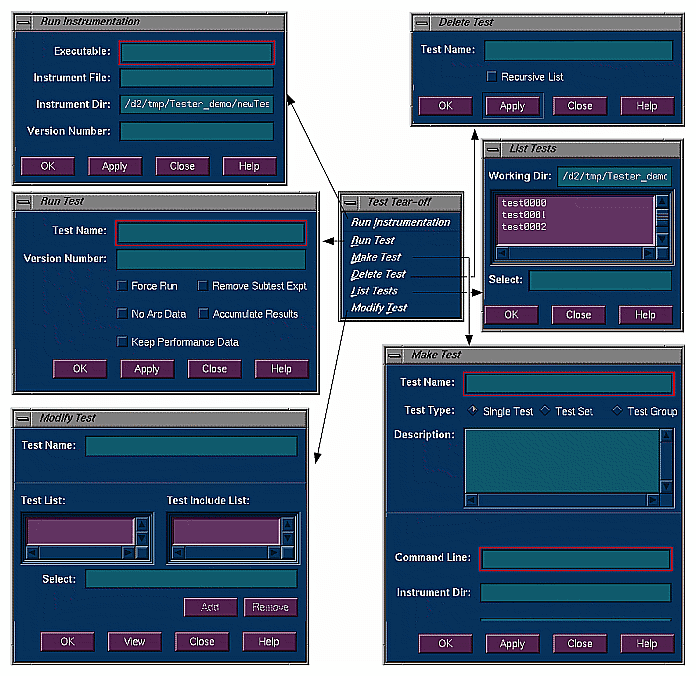
All operations for running tests are accessed from the Test menu in the main Tester window. Figure 5-3, shows the dialog boxes used to perform test operations.
The Test menu provides the following selections:
Run Instrumentation: instruments the target executable. Instrumentation adds code to the executable to collect coverage data. For a more detailed discussion of instrumentation and instrument files, see “Single Test Analysis Process” in Chapter 1.
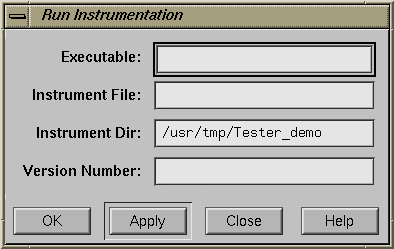
The Run Instrumentation dialog box (see Figure 5-4) has these fields:
Executable lets you enter the name of the target.
Instrumentation File is for entering the instrumentation file, which is an ASCII description of the instrumentation criteria for the experiment.
Instrumentation Dir lets you enter the directory in which the instrumentation file is stored (not necessary if you are using the current working directory).
Version Number lets you specify the version number of the instrumentation directory (ver##<versionnumber>). If this field is left blank, the version number increments automatically.
If you are testing multiple executables (that is, testing coverage of an executable that forks, execs, or sprocs other processes), then you need to store these in the same instrumentation directory. You do this by entering the same number in the Version Number field.
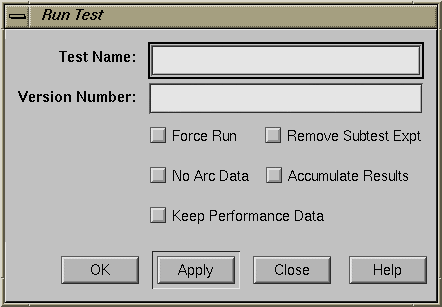
Run Test: invokes the executable with selected arguments and collects the coverage data. The Run Test dialog box (see Figure 5-5) provides these fields and buttons:
Test Name is for entering the test name.
Version Number is for entering the version number of the directory (ver## <number> ) containing the instrumented executable. If you are using the most current (highest) version number, then you can leave the field blank; otherwise, you need to enter the desired number.
Force Run is a toggle that when turned on causes the test to be run even if results already exist.
Keep Performance Data is a toggle that when turned on retains all the performance data collected in the experiment.
Accumulate Results is a toggle that when turned on accumulates (sums over) the coverage data into the existing experiment results.
No Arc Data prevents arc information from being collected in the experiment. It cannot be used with List Arcs or a Call Tree View . List Summary and Compare Test will have 0% coverage on arc items. Use it to save space if you do not need arc data.
Remove Subtest Expt removes results for individual subtests for test sets or test groups, letting you see the top level and taking less space. There will be no data to query if you are querying a subtest.
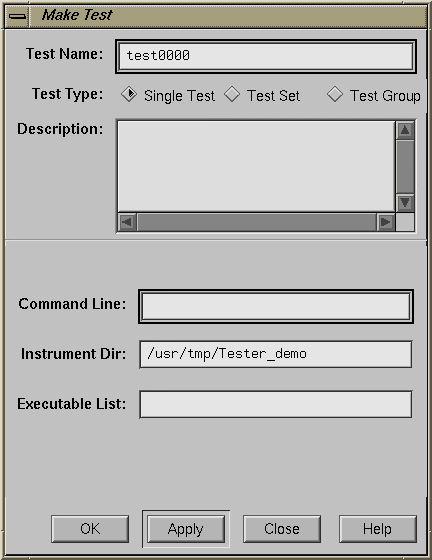
Make Test: creates a test directory where the coverage data is to be stored and stores a TDF (test description file).
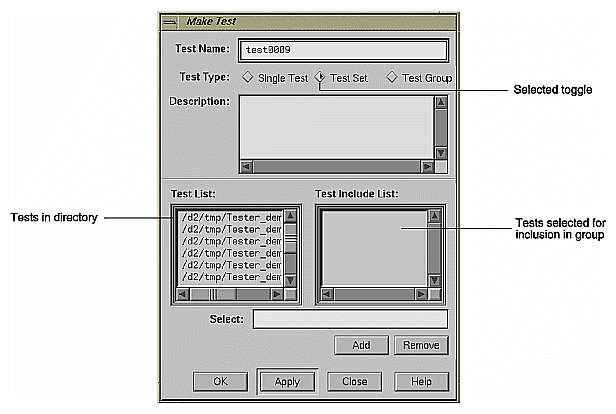
The Make Test dialog box (see Figure 5-6) provides these fields for tests, test sets, and test groups:
Test Name is for entering the test name.
Test Type is a toggle for indicating the type of test: single, test set, or test group (for dynamically shared objects).
Description lets you enter a description to document the test.
If you select Single Test, the following fields are provided:
Command Line lets you enter the target and any arguments to be used in the test.
Instrument Dir is the directory in which the instrumentation file and related data are stored (not necessary if current working directory).
Executable List is used if you are testing coverage of an executable that forks, execs, or sprocs other processes and want to include those processes. You must specify these executables in the Executable List field.
If you select Test Set, the following fields and buttons are provided:
For a test group (see Figure 5-7), the following field is added to the same fields and buttons used for a test set:
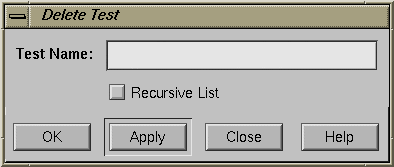
Delete Test: removes the specified test directory and its contents. The Delete Test dialog box (see Figure 5-8) provides these fields:
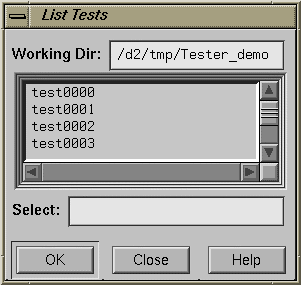
List Tests: shows you the tests in the current working directory. The List Tests dialog box (see Figure 5-9) provides these fields:
Working Dir shows the directory containing the tests.
A scrollable list field displays the tests present in the specified directory. The scroll bars let you navigate through the tests if they do not fit completely in the field. Clicking an item places it in the Select field. Double-clicking on a test selects and loads it.
Select displays the test name you type in or that you clicked in the list. Click OK to load your selection into the Test Name field of the main Tester window.
Close lets you exit without loading a selection.
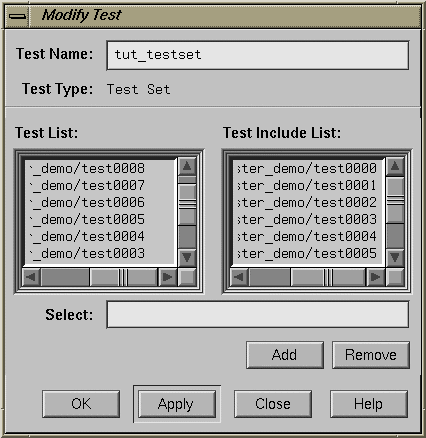
Modify Test: lets you modify a test set or test group. You enter the test name in the Test Name field and press the Return key or click the View button to load it.
The View button changes to Apply, the Test List field displays tests in the current working directory, and the Test Include List field displays the contents of the test set or test group. You can then add or delete tests, test sets, or test groups in the current test set or test group, respectively. The Modify Test dialog box (see Figure 5-10) has these fields:
Test Name is for entering the test name.
Test List displays the tests in the current directory.
Test Include List displays the subtests for the test specified in the Test Name field.
Select displays the test currently selected for adding or removing. You can enter the test directly in this field instead of selecting it from the Test List or Test Include List.
The Add button lets you add the selected test to the Test Include List.
The Remove button lets you delete the selected test from the Test Include List.
The Apply button applies the changes you have selected. (The button name is View until you load something.)
The Views menu has three selections that let you view coverage data in different forms. The selections are:
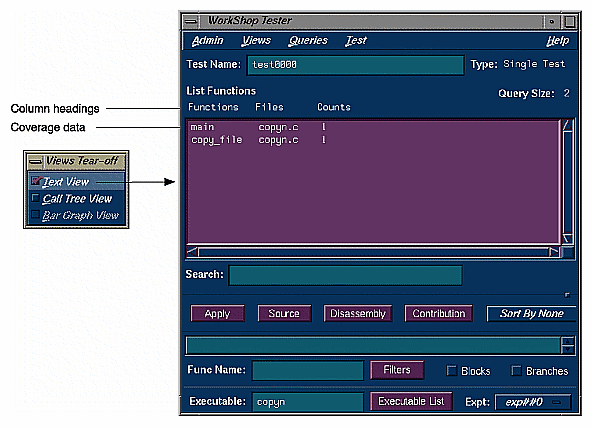
Text View: displays the coverage data in text form. The information displayed depends on which query you have selected. See Figure 5-11.
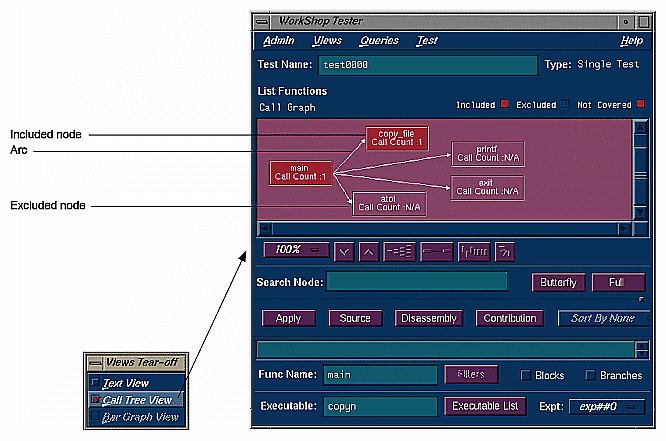
Call Tree View: displays coverage data graphically, with functions as nodes (rectangles) and calls as arcs (connecting arrows). This view is only valid for List Functions, List Blocks, List Branches, and List Arcs. See Figure 5-12. It is not available if you run a test with No Arc Data on.
Bar Graph View: displays a bar chart showing the percentage covered for functions, lines, blocks, branches, and arcs. See Figure 5-13. This view is only valid for List Summary, which is described in detail in “Queries Menu Operations”.
The Queries menu provides different methods for analyzing the results of coverage tests. Each type of query displays the coverage data in the coverage display area in the main Tester window and displays items that are specific to the query in the area below the status area. When you set these items for a query, the same values are used by default for subsequent queries until you change them. You can set these defaults before the first query or as part of any query. For a single test or test set, all queries except Describe Test have the fields shown in Figure 5-15.
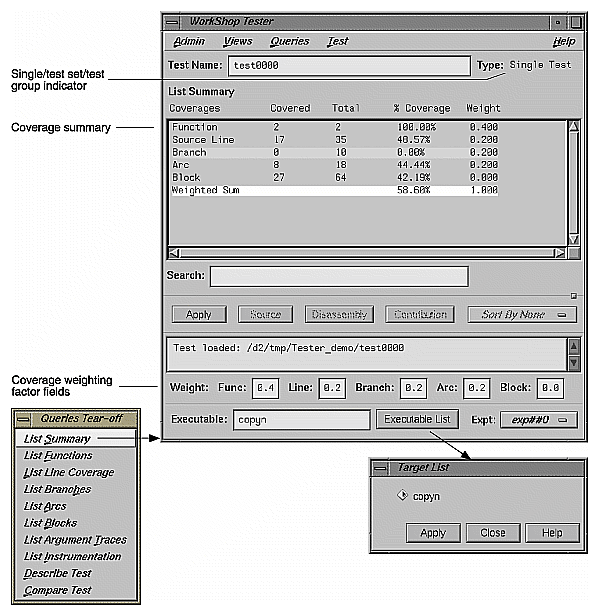
The Executable field displays the executable associated with the current coverage data. You can switch to a different executable by entering it directly in this field. You can also switch executables by clicking the Executable List button, selecting from the list in the Target List dialog box and clicking Apply in the dialog box.
The experiment menu (Expt) lets you see the results for a different experiment that uses the same test criteria.
| Note: When you are performing queries on a test group, the Executable field changes to Object field and the Executable List button changes to Object List as shown in Figure 5-15. These items act analogously except that they operate on dynamically shared objects (DSOs). |
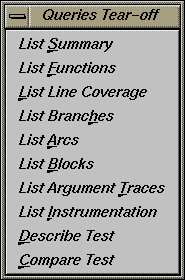
The Queries menu (see Figure 5-16) has these selections:
List Summary: shows the overall coverage based on the user-defined weighted average over function, source line, branch, arc, and block coverage. The coverage data appears in the coverage display area. A typical summary appears in Figure 5-17.
The Coverages column indicates the type of coverage. The Covered column shows the number of functions, source lines, branches, arcs, and blocks that were executed in this test (or test set or test group). The Total column indicates the total number of items that could be executed for each type of coverage. The % Coverage column is simply the Covered value divided by the Total value in each category. The Weight column indicates the weighting assigned to each type of coverage. It is used to compute the Weighted Sum, a user-defined factor that can be used to judge the effectiveness of the test. The Weighted Sum is obtained by first multiplying the individual coverage percentages by the weighting factors and then summing the products.
The List Summary command causes the coverage weighting factor fields to display below the status area. Use these to adjust the factor values as desired. They should add up to 1.0.
If you select Bar Graph View from the Views menu, the summary will be shown in bar graph format as shown in Figure 5-13. The percentage covered is shown along the vertical axis; the types of coverage are indicated along the horizontal axis.
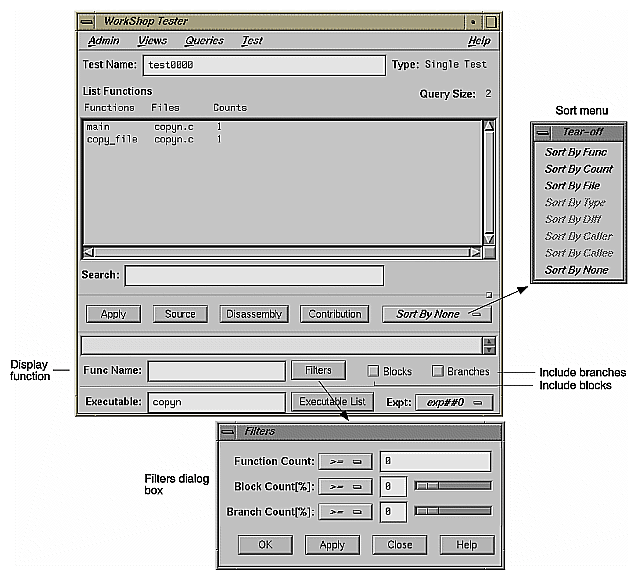
List Functions: displays the coverage data for functions in the specified test. The Functions column heading identifies the function, Files shows the source file containing the function, and Counts displays the number of times the function was executed in the test.
List Functions enables the sort menu that lets you determine the order in which the functions display. Only the sort criteria appropriate for the current query are enabled, in this case, Sort By Func, Sort By Count, and Sort By File as shown in Figure 5-18.
The Search field scrolls the list to the string entered. The string may occur in any of the columns. This is an incremental search and is activated as you enter characters, scrolling to the first matching occurrence.
Entering a function in the Func Name field displays the coverage results limited to that function only in the display area.
The Filters button displays the Filters dialog box, which lets you enter filter criteria to display a subset of the coverage results. There are three types of filters: Function Count, Block Count (%), and Branch Count (%).
For blocks or branch coverage, use the toggles described below. Following each label is an operator menu to define the relationship to the limit quantity entered. Each filter type has a text field for entering the desired limit. The limits for Block Count and Branch Count are percentages (of coverage) and can also be entered using sliders.
Two toggles are available for including branch and block counts. Both appear as actual counts followed by parentheses containing the ratio of counts to total possible.
If you select Call Tree View from the Views menu with a List Functions query, a call graph displays (see Figure 5-19). The call graph displays coverage data graphically, with functions as nodes (rectangles) and calls as arcs (connecting arrows). The nodes are color-coded according to whether the function was included and covered in the test, included and not covered, or excluded from the test. Arcs labeled N/A connect excluded functions and do not have call counts.
If you hold down the right mouse button over a node, the node menu displays, including the function name, coverage statistics, and standard node manipulation commands. If you have a particularly large graph, you may find it useful to zoom to 15% or 40% and look at the coverage statistics through the node menu.
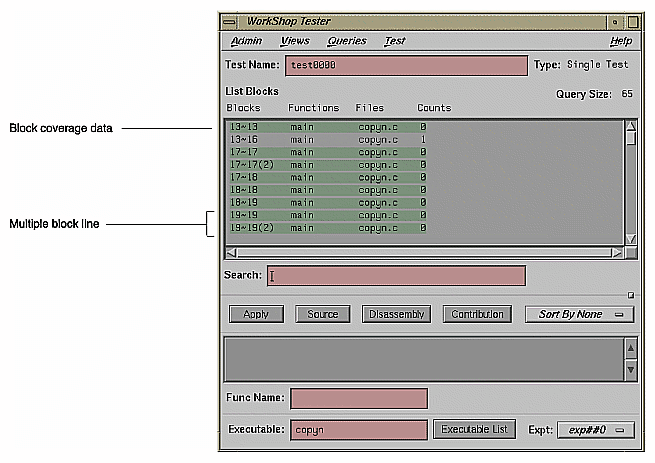
List Blocks: displays a list of blocks for one or more functions and the count information associated with each block (see Figure 5-20). The Blocks column displays the line number in which the block occurs.
If there are multiple blocks in a line, blocks subsequent to the first are shown in order with an index number in parentheses. The other three columns show the function and file containing the block and the count, that is, the number of times the block was executed in the test. Uncovered blocks (those containing 0 counts) are highlighted. Block data can be sorted by function, file, or count.
Be careful before listing all blocks in the program, since this can produce a lot of data. Entering a function in the Func Name field displays the coverage results limited to that function only in the display area.
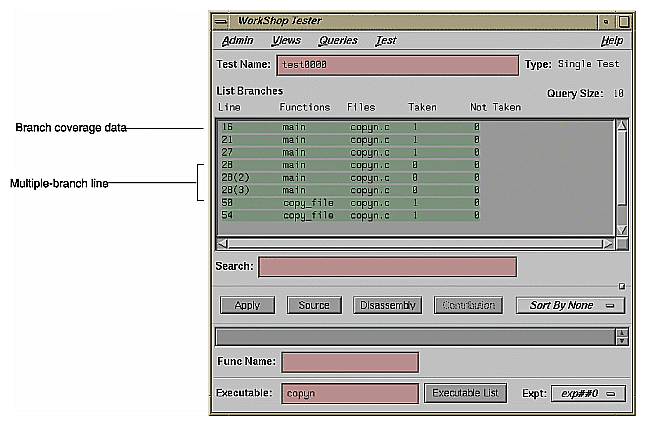
List Branches: lists coverage information for branches in the program. Branch coverage counts assembly language branch instructions that are taken and not taken. See Figure 5-21.
The first column shows the line number in which the branch occurs. If there are multiple branches in a line, they are labeled by order of appearance within trailing parentheses.
The next two columns indicate the function containing the branch and the file. A branch is considered covered if it has been executed under both true and false conditions. The Taken column indicates the number of branches that were executed only under the true condition. The Not Taken column indicates the number of branches that were executed only under the false condition. Branch coverage can be sorted only by function and file.
Entering a function in the Func Name field displays the coverage results limited to that function only in the display area.
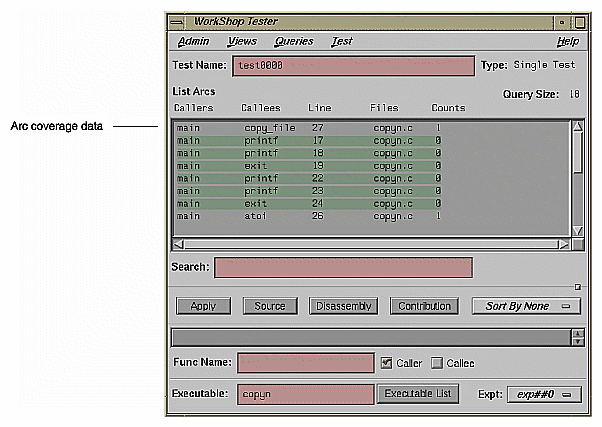
List Arcs: shows arc coverage (that is, the number of arcs taken out of the total possible arcs). An arc is a call from one function (caller) to another (callee). See Figure 5-22. The caller and callee functions are identified in the first two columns. The Line column identifies the line in the caller function where the call occurs. The file and arc execution count display in the last two columns.
Entering a function in the Func Name field displays the coverage results limited to that function only.
The Caller and CalleeFunc Name toggles let you view the arcs for a single function either as a caller or callee. You do this by entering the function name in the field and then clicking the appropriate toggle, or CallerCallee.
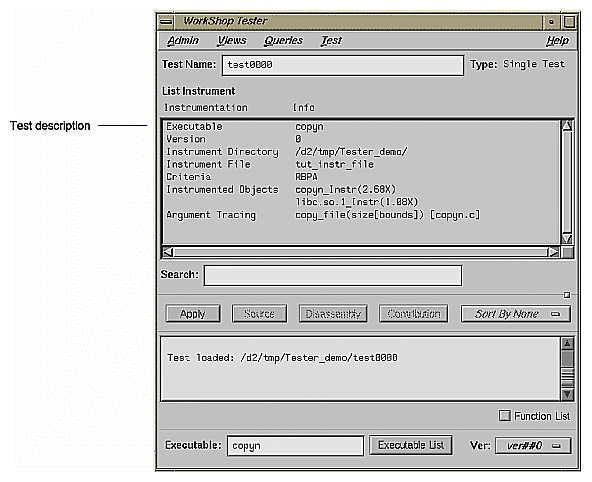
List Instrumentation: displays the instrumentation information for a particular test. See Figure 5-23.
Function List toggle shows the functions that are included in the coverage experiment.
Ver allows you to specify the version of the program that was instrumented. The latest version is used by default.
Executable displays the executable associated with the current coverage data. You can switch to a different executable by entering it directly in this field. You can also switch executables by clicking the Executable List button, selecting from the list in the dialog box, and clicking Apply in the dialog box.
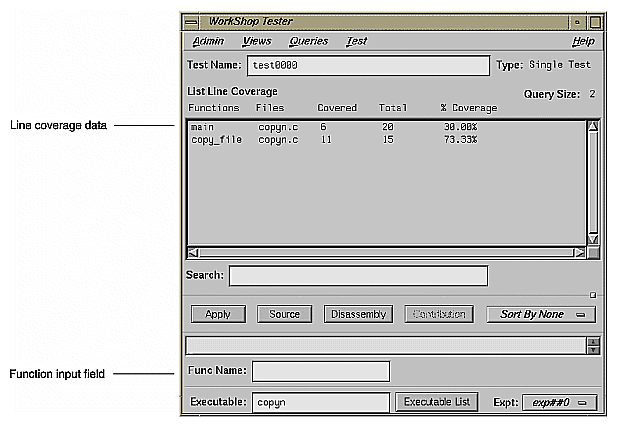
List Line Coverage: lists the coverage for each function for native source lines. Entering a function in the Func Name field displays the coverage results limited to that function only in the display area. See Figure 5-24.
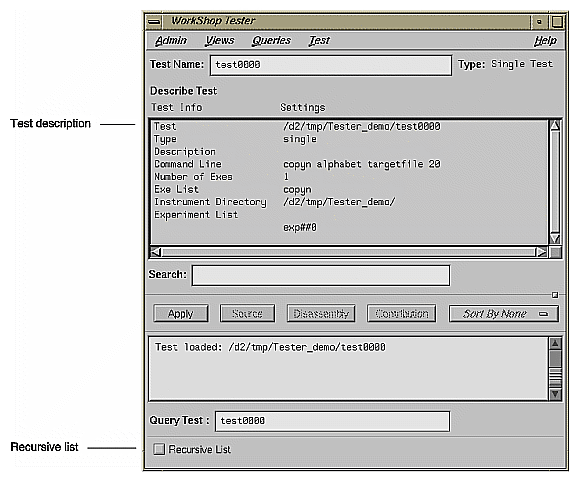
Describe Test: describes the details of the test, test set, or test group. When working with test sets and test groups, it is useful to select the Recursive List toggle, because it describes the details for all subtests. See Figure 5-25.
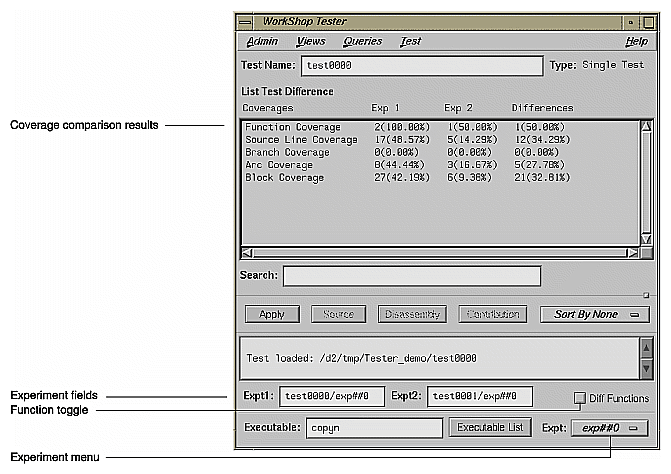
Compare Test: shows the difference in coverage for the same test applied to different versions of the same program. To perform a comparison, you need to select Compare Test from the Queries menu, enter experiment directories in the experiment fields, and click Apply or press Return. The experiments are entered in the form exp##<n> if in the same test or in the form test<nnnn>/exp##<n> when comparing the results of different tests. See Figure 5-26.
The comparison data displays in the coverage display area. The basic types of coverage display in the Coverages column. Result 1 and Result 2 display the results of the experiments specified in the Expt1 and Expt2 fields, respectively. Results are shown as the counts followed by the coverage percentage in parentheses. The values in the Result 2 column are subtracted from those in Result 1 and the differences are shown in the Differences column. If you want to view the available experiments, click the Expt: menu.
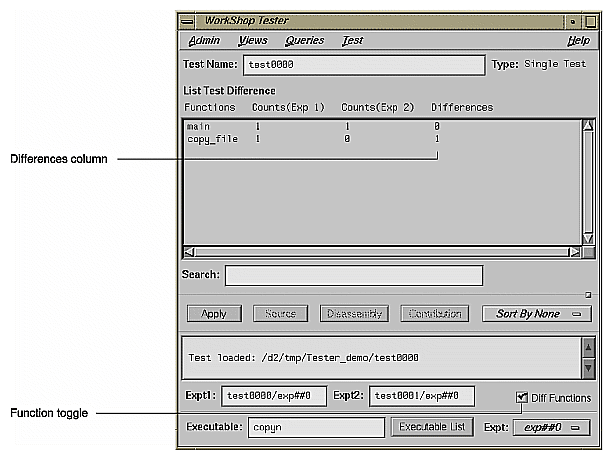
You can also compare the differences in function coverage by clicking the Diff Functions toggle. Figure 5-27, shows a typical function difference example.
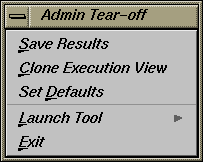
The Admin menu is shown in Figure 5-28.
The Admin menu has these selections:
Save Results: brings up the standard File Browser dialog box so that you can specify a file in which to save the results.
Clone Execution View: displays an Execution View window. Use this if you have closed the initial Execution View window and need a new one. (You need this window to see the results of Run Test.)
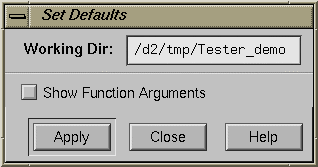
Set Defaults: allows you to change the working directory for work on tests in other directories. Also, you can select whether or not to show function arguments. This is useful when distinguishing functions that have the same name but different arguments (for example, C++ constructors and overloaded functions). See Figure 5-29.
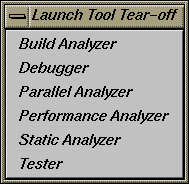
“Launch Tool”: the Launch Tool submenu contains commands for launching other WorkShop applications (see Figure 5-30).
If any of these tools are not installed on your system, the corresponding menu item will be grayed out.
Exit closes all Tester windows.
