WorkShop lets you compile software without leaving the WorkShop environment. Thus, you can look for problems using the WorkShop analysis tools (Static Analyzer, Debugger, and Performance Analyzer), make changes to the source, suspend your testing, and run a compile. WorkShop provides two tools to help you compile:
Build View--for compiling, viewing compile error lists, and accessing the code containing the errors in Source View (the WorkShop editor) or an editor of your choice. Build View helps you find files containing compile errors so that you can quickly fix them, recompile, and resume testing.
Build Analyzer--for viewing build dependencies and recompilation requirements and accessing source files.
Build View uses the UNIX make(1) facility as its default build software. Although cvmake can be set up to run any program instead of make (for example, gnumake), cvbuild will only parse and display standard makefiles (in particular, it does not understand gnu make constructs).
You can access the Build View window from the WorkShop analysis tools, from the command line (by typing cvmake), or from the Build Analyzer (see next section).
To access Build View from WorkShop, select Recompile from the Source menu in the Main View window in the Debugger or from the File menu in Source View (for more information on the Main View and Source View windows, refer to Chapter 1, “WorkShop Debugger Overview”). Selecting Recompile detaches the current executable from the WorkShop analysis tools and displays Build View. You can edit the Directory and Target(s): fields as needed and click Build to compile. If the source compiles successfully, the new executable is reattached when you reenter the WorkShop analysis tools.
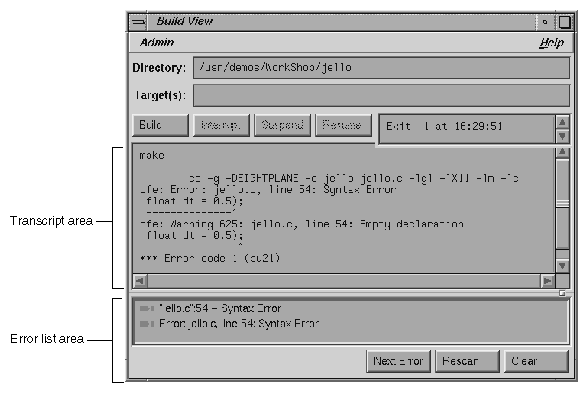
The Build View window has three major areas:
The build process control area lets you run or stop the build and view the status. See Figure A-1.
The directory in which the build will run displays in the Directory: field at the top of the area. The current directory displays by default. You can specify the build using make, smake, pmake, clearmake, or any other builder and any flags or options that the builder understands (see “Build View Preferences”, and “Build Options”). The target to be built is specified in the Target(s): field.
The build process control buttons let you control the build process. The following buttons are available:
| Build | Runs (or reruns) a build. If you have modified any files you will be prompted to save the new versions prior to the compile. |
| Interrupt | Stops a build. |
| Suspend | Stops a build temporarily. |
| Resume | Restarts a suspended build. |
The status field is to the right of the build process control buttons. It indicates the progress of the build.
The transcript area displays the verbatim output from the build. The vertical scroll bar lets you go through the list; the horizontal scroll bar lets you see long messages obscured from view. A sash between the compile transcript area and the error list area lets you adjust the lengths of the lists displayed. See Figure A-2.
The error list area consists of the error list display and three control buttons. The following buttons are available:
| Next Error | Brings up the default editor scrolled to the next error location. This button is below the error list display. |
| Rescan | Refreshes the error list display. |
| Clear | Clears the error list display area. |
The error list area displays compile errors (see Figure A-2). The errors are annotated according to their severity level (fatal has a solid icon and the warning icon is hollow). Double-clicking the text portion of an error brings up the default editor scrolled to the error location and displays a check mark to help you keep track of where you are in the error list. Check marks also display when you click the Next Error button.
The Admin menu in Build View has two selections in addition to the standard WorkShop entries:
For information on the Launch Tool and Exit menu selections, see the ProDev WorkShop: Debugger Reference Manual.
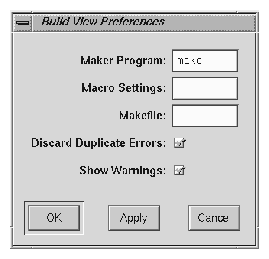
The Preferences selection brings up the dialog box shown in Figure A-3. The options are:
| Maker Program field | ||
Lets you enter the program you use to build your executable. | ||
| Macro Settings field | ||
Lets you enter build macros, such as
| ||
| Makefile field | ||
Lets you enter the name of a makefile if you do not wish to use the default. | ||
| Discard Duplicate Errors button | ||
Eliminates subsequent duplicates of errors in the error list area. | ||
| Show Warnings button | ||
Toggles the option to display warnings in the list. | ||
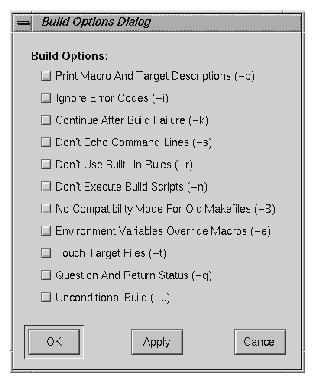
The Build Options Dialog lets you add the options shown in Figure A-4, to your make command.
The steps in running a compile using Build View are as follows:
Bring up the Build View window.
Edit the Target(s): and Directory: fields as required.
Specify your preference regarding duplicate errors and warnings using the Admin menu (optional).
Click Build to start the build. All compile information displays in the transcript area. Errors are grouped in a list below.
Click Interrupt to terminate or Suspend for a temporary stop, if you want to stop the build. The Resume button restarts a suspended build.
Double-click an error to bring up your preferred editor with the appropriate source code. A check mark indicates that an error has been accessed.

Note: The default editor is determined by the editorCommand resource in the app-defaults file. The value of this resource defaults to wsh -c vi +%d, which means run vi in a wsh window and scroll to the current line. If the editor lets you specify a starting line, enter %d in the resource to indicate the new line number. Click Build to restart the build.
The Build Analyzer window displays a graph indicating the source files and derived files in the build, and their dependency relationships and current status. Source files refers to input files, such as code modules, documentation, data files, and resources. Derived files refers to output files, such as compiled code. Your request builds in Build Analyzer by either:
Double-clicking a derived module
Making a selection from the Build menu
You access Build Analyzer from WorkShop by selecting Launch Tool from the Admin menu in Main View. Outside of WorkShop, you can access Build Analyzer by typing cvbuild at the command line.
The three fields in the build specification area identify the working directory, makefile script, and target file(s) for compilation. You can edit the Directory, Makefile, and Targets fields directly. The Targets field also lets you specify a search string for locating a file in the build graph.
The build graph area displays the specified source and derived files and their dependency relationships. Files are depicted as rectangles; dependency relationships are shown as arrows, with the supplying file at the base of the arrow and the dependent file at the head. The colors used to depict the files depends on your color scheme. Build Analyzer differentiates the two types of files by depicting one with light characters on a dark background and the other with dark text on a light background. If you double-click a source file icon, an editor is brought up for that file. Double-clicking a derived file starts a build and displays Build View.
In addition to dependency relationships, Build Analyzer indicates the status of the files and relationships as follows:
Source file availability status: normal or checked out
Normal means that the source file is read-only and needs to be made writable to be edited. Normal files appear as light rectangles with black text.
Checked out means that you have a writable version of this file available and can thus edit it. A checked out file appears in a different color (from normal files) with a shadow.
Derived file compile status: current or obsolete
When applied to a derived file, the term current means that none of the files on which the derived file depends have been edited since the derived file was created. Current derived files appear as dark rectangles with white text.
Obsolete means that one or more of the source files have been modified since the derived file was created. Obsolete files appear in the same color as current derived files but with a colored outline.
Dependency relationship: current or obsolete
Current means that the derived file is up to date with the source files. Note that a relationship can be current even if both files are obsolete. This happens when a file on which both files are dependent has been modified. Current arcs are black.
Obsolete means that the source file has changed and the derived file has not been updated accordingly. Obsolete arcs appear as colored arrows.
Some typical build graph icons are shown in Figure A-5.
The main.c and hello.h source files are in their normal state. The source files warn.c++ and foo.h are checked out and thus appear highlighted and with dropped shadows. The derived file main.o is current, since it has not changed since the last compile. The black dependency arcs indicate that the source and derived files at either end are current with each other. When an arc is highlighted, it indicates that the source has changed since the last compile. The derived files warn.o and a.out are obsolete because warn.c++ has changed.
The build graph control area contains a row of graph control buttons similar to the ones in the WorkShop Static Analyzer and the Call Graph View in the Performance Analyzer. The Overview button is particularly useful in the Build Analyzer because it helps you quickly find obsolete files where a lot of dependencies are involved.
The build graph control area is shown in Figure A-6.
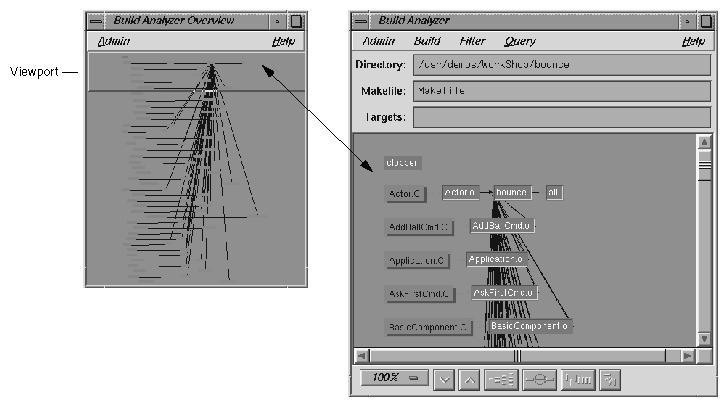
Since build graphs can get quite complicated, an overview mode (similar to those in Static Analyzer and Profiling View) is supplied that lets you view the entire graph at a reduced scale. To display the overview window, you click the overview icon (see Figure A-6).
Figure A-7, shows a typical Build Analyzer Overview window with the resulting graph. The window has a movable viewport that lets you select the portion of the build graph displayed in Build Analyzer. Source files that have changed and derived files needing recompilation are highlighted for easy detection. In this particular color scheme, the Build Analyzer Overview window displays normal source files in turquoise, checked out source files in pink, current derived files in dark blue, and obsolete derived files in yellow. Arcs appear only in black in this window.
The Build Analyzer window contains the following menus:
Admin
Build
Filter
Query
The Admin menu provides one selection Refresh Graph Display in addition to the standard WorkShop selections.
| Refresh Graph Display | |
Refreshes the window. | |
| Launch Tool | |
Lets you execute the WorkShop tools. For more information, see the ProDev WorkShop: Debugger Reference Manual. | |
The selections in the Build menu let you perform builds as follows:
| Build Default Target | |
Performs a make with no arguments. | |
| Build Selected Target(s) | |
Performs the build(s) as entered in the Target(s): field. | |
| Show Build Rule | |
Displays a dialog box showing the makefile line for the selected node. | |
The Filter menu has only one selection:
| Select files to show in graph | |
Opens the File Filter dialog box that lets you enter a regular expression to filter files displayed in the build graph. The upper list area lets you specify files to be excluded from the build graph. The lower list is for specifying files to appear in the graph. | |
The Query menu lets you request information about the build graph. The following selections are available:
| Why Is This File Out Of Date? | |
Identifies the source files requiring this file to be recompiled. This query only applies to derived files. | |
| What Will Changing This File Affect? | |
Shows all derived files dependent on this source file. | |


