You can view the system status in the following ways:
| Note: Administrative tasks must be performed using the GUI when it is connected to a CXFS administration node (a node that has the cluster_admin software package installed) or using the cmgr command when logged in to a CXFS administration node. Administration commands must be run on a CXFS administration node; the cxfs_info status command is run on a client-only node. |
Monitor log files. See “Status in Log Files”
Use the GUI or the tail command to view the end of the system log file:
IRIX: /var/adm/SYSLOG
Linux: /var/log/messages
Keep continuous watch on the state of a cluster using the GUI view area or the cluster_status command.
Query the status of an individual node or cluster using either the GUI or the cmgr command.
Manually test the filesystems with the ls command.
Monitor the system with Performance Co-Pilot. You can use Performance Co-Pilot to monitor the read/write throughput and I/O load distribution across all disks and for all nodes in the cluster. The activity can be visualized, used to generate alarms, or archived for later analysis. You can also monitor XVM statistics. See the Performance Co-Pilot for IA-64 Linux User's and Administrator's Guide, Performance Co-Pilot for IRIX Advanced User's and Administrator's Guide, the Performance Co-Pilot Programmer's Guide, and the dkvis, pmie, pmieconf, and pmlogger man pages.

Note: You must manually install the XVM statistics for the Performance Co-Pilot package; it is not installed by default. See Chapter 6, “IRIX CXFS Installation”.
The following sections describe the procedures for performing some of these tasks:
You should monitor the following log files listed for problems:
Administration node logs:
System log:
IRIX: /var/adm/SYSLOG
Linux: /var/log/messages
Look for a Membership delivered message to indicate that a cluster was formed.
Events from the GUI and clconfd: /var/cluster/ha/log/cad_log
Kernel status: /var/cluster/ha/log/clconfd_ hostname
Command line interface log:/var/cluster/ha/log/cli_ hostname
Monitoring of other daemons:/var/cluster/ha/log/cmond_log
Reset daemon log: /var/cluster/ha/log/crsd_ hostname
Output of the diagnostic tools such as the serial and network connectivity tests: /var/cluster/ha/log/diags_ hostname
Cluster database membership status: /var/cluster/ha/log/fs2d_log
System administration log, which contains a list of the commands run by the GUI:
IRIX: /var/sysadm/salog
Linux: /var/lib/sysadm/salog
Client-only node log files:
cxfs_client log file:
IRIX: /var/adm/cxfs_client
Linux 64-bit: /var/log/cxfs_client
System log:
IRIX: /var/adm/SYSLOG
Linux 64-bit: /var/log/messages
Look for a Membership delivered message to indicate that a cluster was formed.
Output of the diagnostic tools such as the serial and network connectivity tests: /var/cluster/ha/log/diags_ hostname
The Linux 64-bit platform uses the logrotate system utility to rotate the cxfs_client logs:
The /etc/logrotate.conf file specifies how often system logs are rotated
The /etc/logrotate.d/cxfs_client file specifies the manner in which cxfs_client logs are rotated
For information about client-only nodes running other operating systems, see CXFS MultiOS Client-Only Guide for SGI InfiniteStorage.
If the disk is filling with log messages, see “Log File Management” in Chapter 12.
| Caution: Do not change the names of the log files. If you change the names, errors can occur. |
You can monitor system status with the GUI or the cluster_status , clconf_info, cmgr, or cxfs_info commands. Also see “Key to Icons and States” in Chapter 10
The easiest way to keep a continuous watch on the state of a cluster is to use the view area and choose the following:
Edit -> Expand All
The cluster status can be one of the following:
ACTIVE, which means the cluster is up and running.
INACTIVE, which means the start CXFS services task has not been run.
ERROR, which means that some nodes are in a DOWN state; that is, the cluster should be running, but it is not.
UNKNOWN, which means that the state cannot be determined because CXFS services are not running on the node performing the query. For more information, see in “Node Status”.
You can use the cluster_status command to monitor the cluster using a curses interface. For example, the following shows a three-node cluster with a single filesystem mounted and the help text displayed:
# /var/cluster/cmgr-scripts/cluster_status
+ Cluster=cxfs6-8  FailSafe=Not Configured CXFS=ACTIVE               15:15:33
   Nodes =   cxfs6    cxfs7    cxfs8
FailSafe =
    CXFS =      UP       UP       UP

CXFS              DevName           MountPoint           MetaServer     Status
        /dev/cxvm/concat0             /concat0                cxfs7         UP

                       +-------+ cluster_status Help +--------+
                       |  on s  - Toggle Sound on event       |
                       |  on r  - Toggle Resource Group View  |
                       |  on c  - Toggle CXFS View            |
                       |     h  - Toggle help screen          |
                       |     i  - View Resource Group detail  |
                       |     q  - Quit cluster_status         |
                       +--- Press 'h' to remove help window --+

----------------------------------------------------------------
cmd('h' for help) > |
The above shows that a sound will be activated when a node or the cluster changes status. (The r and i commands are not relevant for CXFS; they are of use only with FailSafe.) You can override the s setting by invoking cluster_status with the -m (mute) option.
The following output shows that the CXFS cluster is up and that cxfs7 is the metadata server for the /dev/cxvm/concat0 XVM volume:
cxfs6# /var/cluster/cmgr-scripts/cluster_status

+ Cluster=cxfs6-8  FailSafe=Not Configured CXFS=ACTIVE               15:18:28
   Nodes =   cxfs6    cxfs7    cxfs8
FailSafe =
    CXFS =      UP       UP       UP

CXFS              DevName           MountPoint           MetaServer     Status
/dev/cxvm/concat0 /concat0 cxfs7 UP |
If the cluster is up, you can see detailed information by using /usr/cluster/bin/clconf_info.
For example:
cxfs6 # clconf_info Membership since Thu Mar 1 08:15:39 2001 Node NodeId Status Age Incarnation CellId cxfs6 6 UP 0 0 2 cxfs7 7 UP 0 0 1 cxfs8 8 UP 0 0 0 1 CXFS FileSystems /dev/cxvm/concat0 on /concat0 enabled server=(cxfs7) 2 client(s)=(cxfs8,cxfs6) |
Inactive nodes are shown as DOWN.
To query node and cluster status, use the following cmgr command:
cmgr> show status of cluster cluster_name |
The cxfs_info command provides information about the cluster status, node status, and filesystem status. cxfs_info is run from a client-only node:
/usr/cluster/bin/cxfs_info |
You can use the -e option to display information continuously, updating the screen when new information is available; use the -c option to clear the screen between updates. For less verbose output, use the -q (quiet) option.
For example, on a Solaris node named cxfssun4:
cxfssun4 # /usr/cxfs_cluster/bin/cxfs_info
cxfs_client status [timestamp Sep 03 12:16:06 / generation 18879]

Cluster:
    sun4 (4) - enabled
Local:
    cxfssun4 (2) - enabled, state: stable, cms: up, xvm: up, fs: up
Nodes:
    cxfs27     enabled  up    1
    cxfs28     enabled  up    0
    cxfsnt4    enabled  up    3
    cxfssun4   enabled  up    2
    mesabi     enabled  DOWN  4
Filesystems:
    lun1s0     enabled  mounted          lun1s0               /lun1s0
mirror0 disabled unmounted mirror0 /mirror0 |
To query the status of a node, you provide the logical name of the node. The node status can be one of the following:
UP, which means that CXFS services are started and the node is part of the CXFS kernel membership. For more information, see “CXFS Kernel Membership, Quorum, and Tiebreaker” in Appendix B.
DOWN, which means that although CXFS services are started and the node is defined as part of the cluster, the node is not in the current CXFS kernel membership.
INACTIVE, which means that the start CXFS services task has not been run.
UNKNOWN, which means that the state cannot be determined because CXFS services are not running on the node performing the query.
State information is exchanged by daemons that run only when CXFS services are started. A given CXFS administration node must be running CXFS services in order to report status on other nodes.
For example, CXFS services must be started on node1 in order for it to show the status of node2. If CXFS services are started on node1, then it will accurately report the state of all other nodes in the cluster. However, if node1's CXFS services are not started, it will report the following states:
INACTIVE for its own state, because it can determine that the start CXFS services task has not been run
UNKNOWN as the state of all other nodes, because the daemons required to exchange information with other nodes are not running, and therefore state cannot be determined
The following sections provide different methods to monitor node status. Also see “Check Cluster/Node/Filesystem Status with cxfs_info”.
You can use the view area to monitor the status of the nodes. Select View: Nodes and Cluster.
To determine whether a node applies to CXFS, to FailSafe, or both, double-click the node name in the display.
To query node status, use the following cmgr command:
cmgr> show status of node node_name |
You can use the cluster_status command to monitor the status of the nodes in the cluster. For example, the following output shows that all three nodes in the CXFS cluster are up:
cxfs6# /var/cluster/cmgr-scripts/cluster_status

+ Cluster=cxfs6-8  FailSafe=Not Configured CXFS=ACTIVE               15:15:33
   Nodes =   cxfs6    cxfs7    cxfs8
FailSafe =
CXFS = UP UP UP |
If you toggle the c command to off, the CXFS line will disappear.
When CXFS is running, you can determine whether the system controller on a node is responding by using the following cmgr command:
cmgr> admin ping node node_name |
This command uses the CXFS daemons to test whether the system controller is responding.
You can verify reset connectivity on a node in a cluster even when the CXFS daemons are not running by using the standalone option of the admin ping command:
cmgr> admin ping standalone node node_name |
This command calls the ping command directly to test whether the system controller on the indicated node is responding.
| Note: This feature assumes that you have installed the pcp_eoe and pcp_eoe.sw.xvm packages; see Chapter 6, “IRIX CXFS Installation”. |
You can use Performance Co-Pilot to monitor XVM statistics. To do this, you must enable the collection of statistics:
To enable the collection of statistics for the local host, enter the following:
$ pmstore xvm.control.stats_on 1
To disable the collection of statistics for the local host, enter the following:
$ pmstore xvm.control.stats_on 0
You can gather XVM statistics in the following ways:
By using the pmval command from the IRIX pcp_eoe.sw.monitor package and the Linux 64-bit pcp RPM. It can be used to produce an ASCII report of selected metrics from the xvm group in the Performance Co-Pilot namespace of available metrics.
By using the optional pmgxvm command provided with the Performance Co-Pilot pcp.sw.monitor package (an optional product available for purchase).
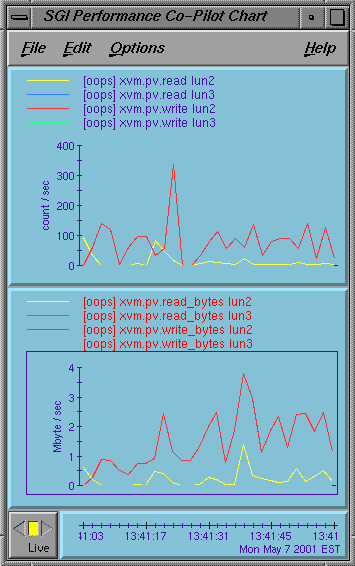
If you have the pcp.sw.monitor package, you can also use the pmchart command to view time-series data in the form of a moving graph. Figure 16-1 shows an example.
To check the current fencing status, select View: Switches in the GUI view area, or use the admin fence query command in cmgr, or use the hafence command as follows:
/usr/cluster/bin/hafence -q |
For example, the following output shows that all nodes are enabled.
# /usr/cluster/bin/hafence -q
  Switch[0] "ptg-brocade" has 8 ports
    Port 1 type=FABRIC status=enabled  hba=210000e08b0102c6 on host thunderbox
    Port 2 type=FABRIC status=enabled  hba=210000e08b01fec5 on host whack
    Port 5 type=FABRIC status=enabled  hba=210000e08b027795 on host thump
Port 6 type=FABRIC status=enabled hba=210000e08b019ef0 on host thud |
A fenced port shows status=disabled. For example:
# /usr/cluster/bin/hafence -q
  Switch[0] "brocade04" has 16 ports
    Port 4 type=FABRIC status=enabled  hba=210000e08b0042d8 on host o200c
    Port 5 type=FABRIC status=enabled  hba=210000e08b00908e on host cxfs30
Port 9 type=FABRIC status=enabled hba=2000000173002d3e on host cxfssun3 |
Verbose (-v) output would be as follows:
# /usr/cluster/bin/hafence -v
  Switch[0] "brocade04" has 16 ports
    Port 0 type=FABRIC status=enabled  hba=2000000173003b5f on host UNKNOWN
    Port 1 type=FABRIC status=enabled  hba=2000000173003adf on host UNKNOWN
    Port 2 type=FABRIC status=enabled  hba=210000e08b023649 on host UNKNOWN
    Port 3 type=FABRIC status=enabled  hba=210000e08b021249 on host UNKNOWN
    Port 4 type=FABRIC status=enabled  hba=210000e08b0042d8 on host o200c
    Port 5 type=FABRIC status=enabled  hba=210000e08b00908e on host cxfs30
    Port 6 type=FABRIC status=enabled  hba=2000000173002d2a on host UNKNOWN
    Port 7 type=FABRIC status=enabled  hba=2000000173003376 on host UNKNOWN
    Port 8 type=FABRIC status=enabled  hba=2000000173002c0b on host UNKNOWN
    Port 9 type=FABRIC status=enabled  hba=2000000173002d3e on host cxfssun3
    Port 10 type=FABRIC status=enabled  hba=2000000173003430 on host UNKNOWN
    Port 11 type=FABRIC status=enabled  hba=200900a0b80c13c9 on host UNKNOWN
    Port 12 type=FABRIC status=disabled hba=0000000000000000 on host UNKNOWN
    Port 13 type=FABRIC status=enabled  hba=200d00a0b80c2476 on host UNKNOWN
    Port 14 type=FABRIC status=enabled  hba=1000006069201e5b on host UNKNOWN
Port 15 type=FABRIC status=enabled hba=1000006069201e5b on host UNKNOWN |
To check current failure action settings, use the show node nodename command in cmgr or use the cms_failconf command as follows:
/usr/cluster/bin/cms_failconf -q |
For example, the following output shows that all nodes except thud have the system default failure action configuration. The node thud has been configured for fencing and resetting.
# cms_failconf -q
CMS failure configuration:
        cell[0] whack    Reset Shutdown
        cell[1] thunderbox       Reset Shutdown
        cell[2] thud     Fence Reset
        cell[3] thump    Reset Shutdown
        cell[4] terry    Reset Shutdown
cell[5] leesa Reset Shutdown |
You can use Performance Co-Pilot or the IRIX icrash command to monitor heartbeat timeouts. For example, the following command prints the evaluation of the mtcp expression and prints it out as a decimal value:
irix# icrash -e '*(mtcp_stat_t *)&mtcp_stat' |
For example:
typedef struct mtcp_stat {
        lock_t  lock;
        int     discovery_enable;
        cell_time_t discovery;          /* max hz discovery thread slept      */
        cell_time_t multicast;          /* max hz multicast thread slept      */
        cell_time_t monitor;            /* max hz between hb monitors         */
        int     gen_hist[MAX_GEN_BKTS]; /* hb generation dlay histogram       */
        int     alive_small;            /* undersized alive mesgs             */
        int     alive_big;              /* oversized alive mesgs              */
        int     invalid_cell;           /* alive msgs with invalid cell       */
        int     invalid_cluster;        /* alive msgs with wrong cluster id   */
        int     wrong_ipaddr;           /* alive msgs from wrong ipaddr       */
        int     not_configured;         /* alive msgs from cells not in config*/
        int     unknown;                /* alive msgs from cells who haven't  */
                                        /* discovered us                      */
        int     gen;         !          /* generation number                  */
        mtcp_hb_mon_config_t hb_config; /* hb mon config info                 */
        mtcp_cell_hb_stat_t *hb_stats[MAX_CELLS];
                                        /* per cell hb stats                  */
        mtcp_cell_seq_stat_t seq_stats[MAX_CELLS];
                                        /* per cell seq # stats               */
        cell_time_t overdue[MAX_CELLS]; /* timestamp when we noticed overdue  */
                                        /* heartbeat */
        int     rescues[MAX_CELLS];     /* number of times tcp rescued failure*/
                                        /* due to overdue heartbeats */
} mtcp_stat_t; |
The following fields contain information that is helpful to analyzing heartbeat timing:
discovery: The maximum time in HZ that the discovery thread (that is, the thread that processes incoming heartbeats) has slept. Because nodes generate heartbeats once per second, this thread should never sleep substantially longer than 100 HZ.
A value much larger than 100 suggests either that it was not receiving heartbeats or that something on the node prevented this thread from processing the heartbeats.
multicast: The thread that generates heartbeats sleeps for 100 HZ after sending the last heartbeat and before starting on the next. This field contains the maximum time in HZ between the start and end of that sleep. A value substantially larger than 100 indicates a problem getting the thread scheduled; for example, when something else on the node is taking all CPU resources.
monitor: The maximum time in HZ for the heartbeat thread to do its sleep and send its heartbeat. That is, it contains the value for multicast plus the time it takes to send the heartbeat. If this value is substantially higher than 100 but multicast is not, it suggests a problem in acquiring resources to send a heartbeat, such as a memory shortage.
gen_hist: A histogram showing the number of heartbeats generated within each interval. There are 6 buckets tracking each of the first 5 seconds (anything over 5 seconds goes into the 6th bucket).
hb_stats: Histograms for heartbeats received. There is one histogram for each node in the cluster.
seq_stats: Number of consecutive incoming heartbeats that do not have consecutive sequence numbers. There is one field for each node. A nonzero value indicates a lost heartbeat message.
overdue: Time when an overdue heartbeat is noticed. There is one field per node.
rescues: Number of heartbeats from a node that are overdue but CXFS message traffic has been received within the timeout period.
alive_small: Number of times a heartbeat message arrived that was too small, (that is, contained too few bytes).
alive_big: Number of times a heartbeat arrived that was too large.
invalid_cell: Number of heartbeats received from nodes that are not defined in the cluster
invalid_cluster: Number of heartbeats received with the wrong cluster ID
wrong_ipaddr: Number of heartbeats received with an IP address that does not match the IP address configured for the node ID
not_configured: Number of heartbeats received from nodes that are not defined in the cluster
unknown: Number of heartbeats from nodes that have not received the local node's heartbeat