This chapter deals with the user interface components that are common to most of the graphical tools and text-based utilities that make up the monitor portion of Performance Co-Pilot (PCP). These are the major sections in this chapter:
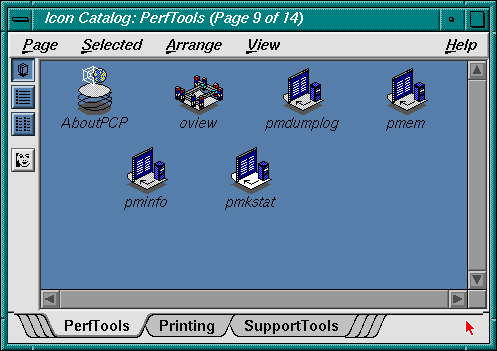
“PerfTools Icon Catalog”, shows a picture of the PerfTools icons.
“Alternate Metrics Source Options”, details some basic standards used in the development of PCP tools.
“General PCP Tool Options”, details other options to use with PCP tools.
“Time Duration and Control”, describes the time control dialog and time-related command line options available for use with PCP tools.
“Transient Problems with Performance Metric Values ”, covers some uncommon scenarios that may compromise performance metric integrity over the short term.
Many of the utilities provided with PCP conform to a common set of naming and syntactic conventions for command line arguments and options. This section outlines these conventions and their meaning. The options may be generally assumed to be honored for all utilities supporting the corresponding functionality.
In all cases, the man pages for each utility fully describe the supported command arguments and options.
Command line options are also relevant when starting PCP applications from the desktop using the Alt double-click method. This technique launches the pmrun program to collect additional arguments to pass along when starting a PCP application.
The conventions and arguments described in this chapter are common to all tools and utilities in the PerfTools Icon Catalog group, shown in Figure 3-1.
The default source of performance metrics is from PMCD on the local host. This section describes how to obtain metrics from sources other than the default.
The option -h host directs any PCP utility to make a connection with the PMCD instance running on host. Once established, this connection serves as the principal real-time source of performance metrics and metadata.
The option -a archive directs the utility to treat the PCP archive logs with base name archive as the principal source of performance metrics and metadata.
PCP archive logs are created with pmlogger . Most PCP utilities operate with equal facility for performance information coming from either a real-time feed via PMCD on some host, or for historical data from a PCP archive log. For more information on archive logs and their use, see Chapter 6, “Archive Logging”.
The base name (archive ) of the PCP archive log used with the -a option implies the existence of the files created automatically by pmlogger, as listed in Table 3-1.
Table 3-1. Physical Filenames for Components of a PCP Archive Log
Filename | Contents |
|---|---|
archive. index | Temporal index for rapid access to archive contents |
archive. meta | Metadata descriptions for performance metrics and instance domains appearing in the archive |
archive.N | Volumes of performance metrics values, for N = 0,1,2,... |
Some tools are able to concurrently process multiple PCP archive logs (for example, for retrospective analysis of performance across multiple hosts), and accept either multiple -a options or a comma separated list of archive names following the -a option.
| Note: The -h and -a options are mutually exclusive in all cases. |
The following sections provide information relevant to most of the PCP tools. It is presented here in a single place for convenience.
The following files and directories are used by the PCP tools as repositories for option and configuration files and for binaries:
The Performance Metrics Name Space (PMNS) defines a mapping from a collection of external names for performance metrics (convenient to the user) into corresponding internal identifiers (convenient for the underlying implementation).
The distributed PMNS used in PCP 2.x avoids most requirements for an alternate PMNS, because clients' PMNS operations are supported at the Performance Metrics Collection Daemon (PMCD) or by means of PMNS data in a PCP archive log. The distributed PMNS is the default, but alternates may be specified using the -n namespace argument to the PCP tools. When a PMNS is maintained on a host, it is likely to reside in the /var/pcp/pmns directory.
Refer to the pmns(4) and pmnscomp(1) man pages for details of PMNS structure and creation.
The periodic nature of sampling performance metrics and refreshing the displays of the PCP tools makes specification and control of the temporal domain a common operation. In the following sections, the services and conventions for specifying time positions and intervals are described.
Many of the performance monitoring utilities have periodic reporting patterns. The -t interval and -s samples options are used to control the sampling (reporting) interval, usually expressed as a real number of seconds (interval), and the number of samples to be reported, respectively. In the absence of the -s flag, the default behavior is for the performance monitoring utilities to run until they are explicitly stopped.
The interval argument may also be expressed in terms of minutes, hours, or days, as described in the PCPIntro(1) man page.
The following options may be used with most PCP tools (typically when the source of the performance metrics is a PCP archive log) to tailor the beginning and end points of a display, the sample origin, and the sample time alignment to your convenience.
The -S, -T, -O and -A command line options are used by PCP applications to define a time window of interest.
| -S duration | The start option may be used to request that the display start at the nominated time. By default, the first sample of performance data is retrieved immediately in real-time mode, or coincides with the first sample of data in a PCP archive log in archive mode. For archive mode, the -S option may be used to specify a later time for the start of sampling. By default, if duration is an integer, the units are assumed to be seconds. To specify an offset from the beginning of a PCP archive (in archive mode) simply specify the offset as the duration. For example, the following entry retrieves the first sample of data at exactly 30 minutes from the beginning of a PCP archive.
To specify an offset from the end of a PCP archive, prefix the duration with a minus sign. In this case, the first sample time precedes the end of archived data by the given duration . For example, the following entry retrieves the first sample exactly one hour preceding the last sample in a PCP archive.
To specify the calendar date and time (local time in the reporting timezone) for the first sample, use the ctime syntax preceded by an “at” sign (@). For example, the following entry specifies the date and time to be used.
Note that this format corresponds to the output format of the date command for easy “cut and paste.” However, be sure to enclose the string in quotes so it is preserved as a single argument for the PCP tool. For more complete information on the date and time syntax, see the PCPIntro(1) man page. | |||
| -T duration | The terminate option may be used to request that the display stop at the time designated by duration. By default, the PCP tools keep sampling performance data indefinitely (in real-time mode) or until the end of a PCP archive (in archive mode). The -T option may be used to specify an earlier time to terminate sampling. The interpretation for the duration argument in a -T option is the same as for the -S option, except for an unsigned time interval that is interpreted as being an offset from the start of the time window as defined by the default (now for real time, else start of archive) or by a -S option. For example, these options define a time window that spans 45 minutes, after an initial offset (or delay) of 1 hour:
| |||
| -O duration | By default, samples are fetched from the start time (see the description of the -S option) to the terminate time (see the description of the -T option). The offset -O option allows the specification of a time between the start time and the terminate time where the tool should position its initial sample time. This option is useful when initial attention is focused at some point within a larger time window of interest, or when one PCP tool wishes to launch another PCP tool with a common current point of time within a shared time window. The duration argument accepted by -O conforms to the same syntax and semantics as the duration argument for -T. For example, these options specify that the initial position should be the end of the time window:
This is most useful with the pmchart command to display the tail-end of the history up to the end of the time window. | |||
| -A alignment | By default, performance data samples do not necessarily happen at any natural unit of measured time. The -A switch may be used to force the initial sample to be on the specified alignment. For example, these three options specify alignment on seconds, half hours, and whole hours:
The -A option advances the time to achieve the desired alignment as soon as possible after the start of the time window, whether this is the default window, or one specified with some combination of -A and -O command line options. |
Obviously the time window may be overspecified by using multiple options from the set -t, -s, -S, -T, -A, and -O. Similarly, the time window may shrink to nothing by injudicious choice of options.
In all cases, the parsing of these options applies heuristics guided by the principal of “least surprise”; the time window is always well-defined (with the end never earlier than the start), but may shrink to nothing in the extreme.
All utilities that report time of day use the local timezone by default. The following timezone options are available:
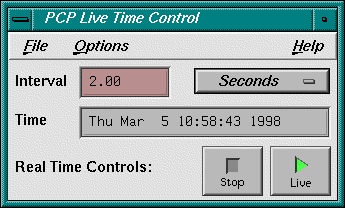
The pmtime PCP Live Time Control dialog, shown in Figure 3-2, is invoked through the PCP tools when you select the Show Time Control option from the Options menu of most PCP tools. The dialog may also be exposed by selecting the “time control state” button at the bottom left-hand corner of the pmchart display or the top left-hand corner of a three-dimensional (3D) performance scene displayed with the pmview or oview tools.
For more information on the “time control state” button, see the pmview(1), oview(1), or pmtime(1) man page.
If the PCP tool is displaying performance metrics from a real-time source, the pmtime dialog looks similar to that shown in Figure 3-2.
This dialog can be used to set the sample interval and units; the latter may be in milliseconds, seconds, minutes, hours, days, or weeks.
To change the units, select the measurement of time you want from the Options menu (labelled Seconds in Figure 3-2).
The ability to start and stop recording of performance activity is available from the oview window using the File -> Record option from the menu bar. Alternatively, use pmlogger directly, as described in Chapter 6, “Archive Logging”.
The ability to provide retrospective performance analysis in the PCP framework is provided by making the monitor tools able to deal interchangeably with real-time sources of performance metrics and PCP archive logs. For more information on archive logging, see Chapter 6, “Archive Logging”.
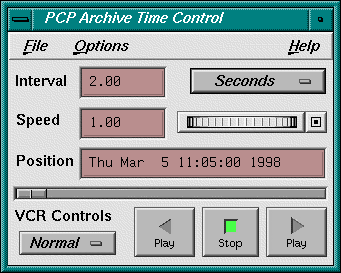
When a PCP tool is displaying performance metrics from a PCP archive log, and the pmtime Archive Time Control dialog is exposed, it looks similar to that shown in Figure 3-3.
As with the live pmtime dialog, the user may change the update interval; however, a number of other controls are available:
The VCR Controls option menu may be used to change the mode of time advance between Normal, Step, and Fast.
In Normal mode, the time advances with the elapsed time per sample being equal to the current Interval (divided by Speed).
In Step mode, each selection of one of the direction buttons advances the time by the current Interval.
In Fast mode, the time advances by the Interval without any added delay.
The Speed text box and associated thumb wheel may be used to make the rate of time advance in Normal mode either slower (Speed < 1) or faster (Speed > 1) than real time.
The Position text box shows the current time within the PCP archive log. The Position may be changed either by advancing the time using the VCR Controls buttons (Play, Step, Rewind, Fast Fwd, or Stop ), or by modifying the Position text box (and pressing Enter), or by moving the slider below the Position text box.
The VCR Controls motion buttons allow time to be advanced forward or backward, or stopped.
The menus of pmtime Archive Time Control provide the following additional features:
The File menu supports the following option:
| Hide | Hides the dialog; the PCP tools provide their own menu options or time control icon that may be used to re-expose the pmtime dialog. |
The Options menu supports three options:
| Timezone | Selects an alternative timezone for all displayed dates and times; all PCP tools attached to the pmtime control are notified of the new timezone. Because the UTC timezone is universal, it is useful when several archives or live sources of data are being displayed in multiple instances of the tools, and comparisons between performance metrics are required to be temporally correlated. Whenever a new source of metrics is opened, whether an archive or live, the timezone at that source of metrics is added to the list in the Options menu. The default timezone is that of the local host where the tool is being run. |
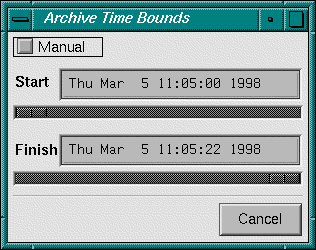
| Show Bounds... | Exposes the Archive Time Bounds dialog, shown in Figure 3-4. This dialog shows the current time window that defines the earliest and latest time for which performance may be displayed from the current archives. |
| Detail | For output fields, selectively includes or excludes the year in the date or milliseconds in time. The year is shown by default, milliseconds are not. |
Sometimes the values for a performance metric as reported by a PCP tool appear to be incorrect. This is typically caused by transient conditions such as metric wraparound or time skew, described below. These conditions result from design decisions that are biased in favor of lightweight protocols and minimal resource demands for PCP components.
In all cases, these events are expected to occur infrequently, and should not persist beyond a few samples.
Performance metrics are usually expressed as numbers with finite precision. For metrics that are cumulative counters of events or resource consumption, the value of the metric may occasionally overflow the specified range and wraparound to zero.
Because the value of these counter metrics is computed from the rate of change with respect to the previous sample, this may result in a transient condition where the rate of change is an unknown value. If the PCP_COUNTER_WRAP environment variable is set, this condition is treated as an overflow, and speculative rate calculations are made. In either case, the correct rate calculation for the metric returns with the next sample.
If a PMDA is tardy in returning results, or the PCP monitoring tool is connected to PMCD via a slow or congested network, an error might be introduced in rate calculations due to a difference between the time the metric was sampled and the time PMCD sends the result to the monitoring tool.
In practice, these errors are usually so small as to be insignificant, and the errors are self-correcting (not cumulative) over consecutive samples.
A related problem may occur when the system time is not synchronized between multiple hosts, and the time stamps for the results returned from PMCD reflect the skew in the system times. In this case, it is recommended that either timeslave or timed be used to keep the system clocks on the collector systems synchronized; see the timed(1M) man page.


