This chapter provides a tutorial for the Tester graphical user interface. It covers these topics:
If you have already set up a tutorial directory for the command line interface tutorial, you can continue to use it. If you remove the subdirectories, your directory names will match exactly; if you leave the subdirectories in, you can add new ones as part of this tutorial.
If you'd like the test data built automatically, run the script:
/usr/demos/WorkShop/Tester/setup_Tester_demo |
To set up a tutorial directory from scratch, do the following; otherwise you can skip the rest of this section.
-
% cp -r /usr/demos/WorkShop/Tester /usr/tmp/tutorial
% cd /usr/tmp/tutorial
% echo ABCDEFGHIJKLMNOPQRSTUVWXYZ > alphabet
% make -f Makefile.tutorial copyn
This moves some scripts and source files used in the tutorial to /usr/tmp/tutorial, creates a test file named alphabet, and makes a simple program, copyn, which copies n bytes from a source file to a target file.
To see how the program works, try a simple test by typing:
% copyn alphabet targetfile 10
% cat targetfile
ABCDEFGHIJ
You should see the first 10 bytes of alphabet copied to targetfile.
Tutorial #1 discusses the following topics:
You typically call up the graphical user interface from the directory that will contain your test subdirectories. This section tells you how to invoke the Tester graphical user interface and describes the main window.
Enter cvxcov from the tutorial directory to bring up the Tester main window.
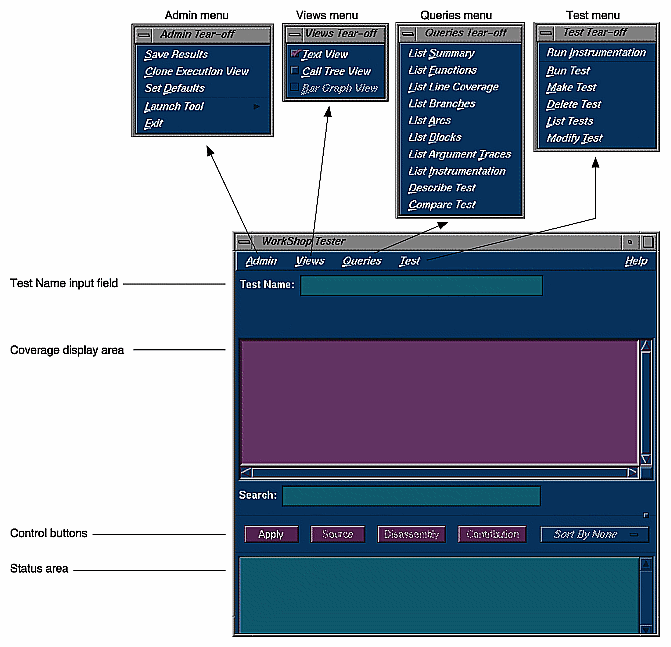
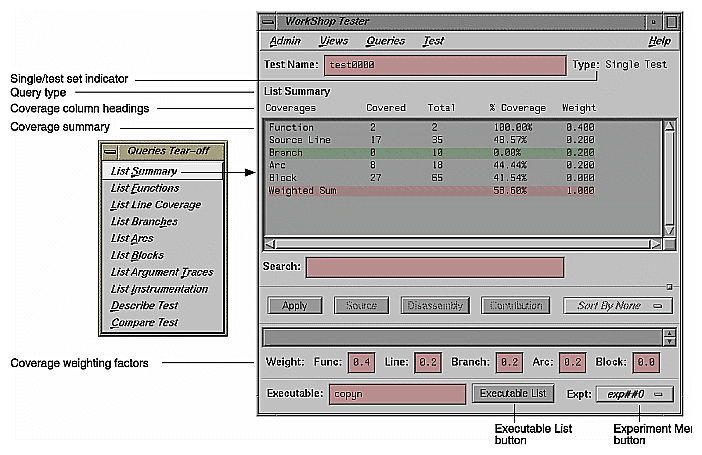
Figure 8-1 shows the main Tester window with all its menus displayed.

Note: You can also access Tester from the Admin menu in other WorkShop tools. Observe the features of the Tester window.
The Test Name field is used to display the current test. You can switch to different tests through this field.
Test results display in the coverage display area. You display the results by choosing an item from the Queries menu. You also can select the format of the data from the Views menu.
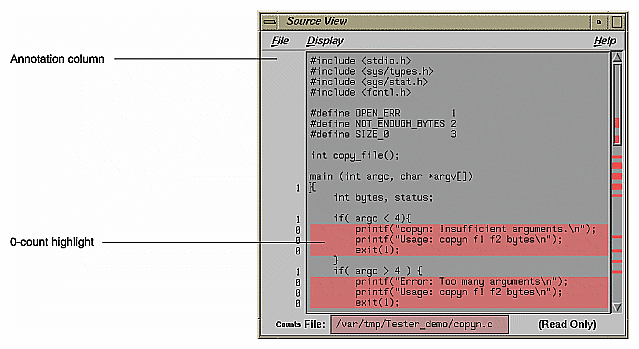
The Source button lets you bring up the standard CASEVision Source View window with Tester annotations. Source View shows the counts for each line included in the test and highlights lines with 0 counts. Lines from excluded functions display but without count annotations.
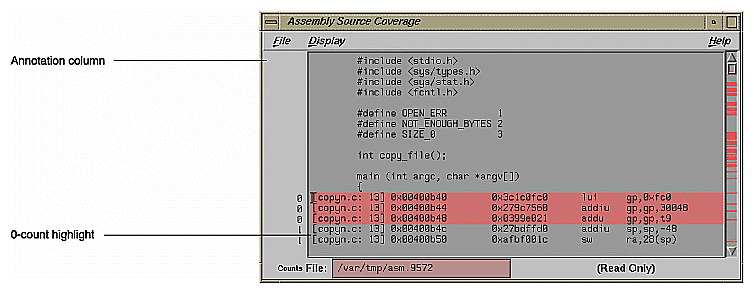
The Disassembly button brings up the CASEVision Disassembly View window for assembly language source. It operates in a similar fashion to the Source button.
The Contribution button displays a separate window with the contributions to the coverage made by each test in a test set or test group.
A sort button lets you sort the test results by such criteria as function, count, file, type, difference, caller, or callee. The criteria available (shown by the name of the button) depend on the current query.
The status area displays status messages regarding the test.
The area below the status area will display special query-specific fields when you make queries.
You can launch other WorkShop applications from the Launch Tool submenu of the Admin menu. The applications include the Build Analyzer, Debugger, Parallel Analyzer, Performance Analyzer, and Static Analyzer.
You'll find an iconized version of Execution View labeled cvxcovExec. It is a shell window for viewing test results as they would appear on the command line.
The first step in providing test coverage is to define the instrumentation criteria in an instrumentation file.
On the command line or from Execution View, enter the following to see the instrumentation directives in the file tut_instr_file used in the tutorials:
% cat tut_instr_file
COUNTS -bbcounts -fpcounts -branchcounts
CONSTRAIN main, copy_file
TRACE BOUNDS copy_file(size)
We will be getting all counting information (blocks, functions, source lines, branches, and arcs) for the two functions specified in the CONSTRAIN directive, main and copy_file. We will also be tracing the size argument for the copy_file function.
Select "Run Instrumentation" from the Test menu.
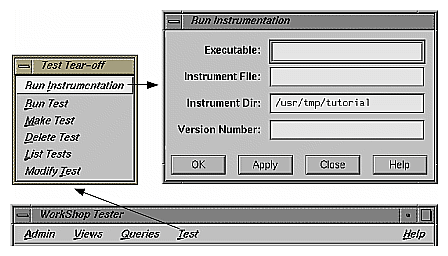
This process inserts code into the target executable that enables coverage data to be captured. The dialog box shown in Figure 8-2 displays when "Run Instrumentation" is selected from the Test menu.
Enter copyn in the Executable field.
The Executable field is required, as indicated by the red highlight. You enter the executable in this field.
Enter tut_instr_file in the Instrument File field.
The Instrument File field lets you specify an instrumentation file containing the criteria for instrumenting the executable. In this tutorial, we use the file tut_instr_file, which was described earlier.
Leave the Instrument Dir and Version Number fields as is.
The Instrument Dir field indicates the directory in which the instrumented programs are stored. A versioned directory is created (the default is ver##n, where n is 0 the first time and is incremented automatically if you subsequently change the instrumentation). The version number n helps you identify the instrumentation version you use in an experiment. The experiment results directory will have a matching version number. The instrument directory is the current working directory; it can be set from the Admin menu.
Click OK.
This executes the instrumentation process. If there are no problems, the dialog box closes and the message Instrumentation succeeded displays in the status area with the version number created.
A test defines the program and arguments to be run, the instrumentation criteria, and descriptive information about the test.
Select "Make Test" from the Test menu.
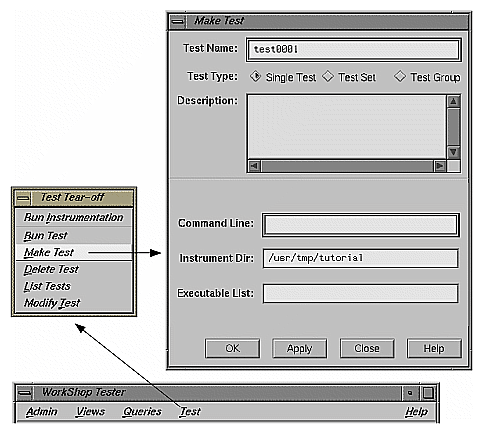
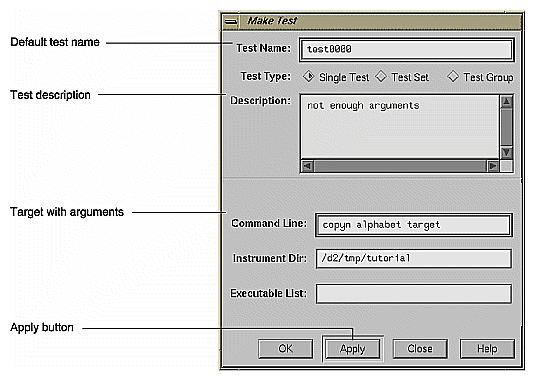
This creates a test directory. Figure 8-3 shows the Make Test window.
You specify the name of the test directory in the Test Name field, in this case test0000. The field displays a default directory test<nnnn>, where nnnn is 0000 the first time and incremented for subsequent tests. You can edit this field if necessary.
Enter a description of the test in the Description field.
This is optional, but can help you differentiate between tests you have created.
Enter the executable to be tested with its arguments in the Command Line field, in this example:
copyn alphabet targetfile 20
Leave the remaining fields as is.
Tester supplies a default instrumentation directory in the Instrument Dir field. The Executable List field lets you specify multiple executables when your main program forks, execs, or sprocs other processes.
Click OK to perform the make test operation with your selections.
The results of the make test operation display in the status area of the main Tester window.
To run a test, we use technology from the WorkShop Performance Analyzer. The instrumented process is set to run, and a monitor process (cvmon) captures test coverage data by interacting with the WorkShop process control server (cvpcs).
Select "Run Test" from the Test menu.
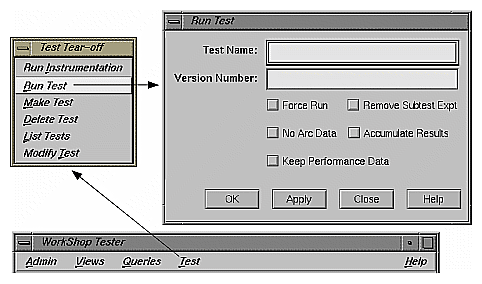
The dialog box shown in Figure 8-4 displays. You enter the test directory in the Test Name field. You can also specify a version of the executable in the Version Number field if you don't wish to use the latest, which is the default. The Force Run toggle forces the test to be run again even if a test result already exists. The Keep Performance Data toggle retains all the performance data collected in the experiment. The Accumulate Results toggle sums over the coverage data into the existing experiment results. Both No Arc Data and Remove Subtest Expt toggles retain less data in the experiments and are designed to save disk space.
Enter test0000 in the Test Name field.
Click OK to run the test with your selections.
When the test completes, a status message showing completion displays and you will have data to be analyzed. You can observe the test as it runs in Execution View.
Analyzing the Results of a Coverage Test
You can analyze test coverage data in many ways. In this tutorial, we will illustrate a simple top-down approach. We will start at the top to get a summary of overall coverage, proceed to the function level, and finally go to the actual source lines.
Having collected all the coverage data, now you can analyze it. You do this through the Queries menu in the main Tester window.
Enter test0000 in the Test Name field in the main window and select "List Summary" from the Queries menu.
This loads the test and changes the main window display as shown in Figure 8-5. The query type (in this case, "List Summary") is indicated above the display area. Column headings identify the data, which displays in columns in the coverage display area. The status area is shortened. The query-specific fields (in this case, coverage weighting factors) that appear below the control buttons and status area are different for each query type. You can change the numbers and click Apply to weight the factors differently. The Executable List button brings up the Target List dialog box. It displays a list of executables used in the experiment and lets you select different executables for analysis. You can select other experiments from the experiment menu (Expt).
"List Summary" shows the coverage data (number of coverage hits, total possible hits, percentage, and weighting factor) for functions, source lines, branches, arcs, and blocks. The last coverage item is the weighted average, obtained by multiplying individual coverage averages by the weighting factors and summing the products.
Select "List Functions" from the Queries menu.
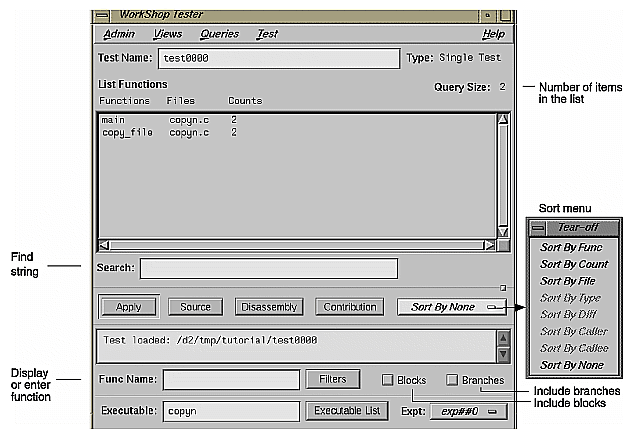
This query lists the coverage data for functions specified for inclusion in this test. The default version is shown in Figure 8-6, with the available options.
If there are functions with 0 counts, they will be highlighted. The default column headings are Functions, Files, and Counts.
Click the Blocks and Branches toggles.
The Blocks and Branches toggle buttons let you display these items in the function list. Figure 8-7 shows the display area with Blocks and Branches enabled.
The Blocks column shows three values. The number of blocks executed within the function is shown first. The number of blocks covered out of the total possible for that function is shown inside the parentheses. If you divide these numbers, you'll arrive at the percentage of coverage.
Similarly, the Branches column shows the number of branches covered, followed by the number covered out of the total possible branches. The term covered means that the branch has been executed under both true and false conditions.
Select the function main in the display area and click Source.
The Source View window displays with count annotations as shown in Figure 8-8. Lines with 0 counts are highlighted in the display area and in the vertical scroll bar area. Lines in excluded functions display with no count annotations.
Click the Disassembly button in the main window.
The Disassembly View window displays with count annotations as shown in Figure 8-9. Lines with 0 counts are highlighted in the display area and in the vertical scroll bar area.
In the second tutorial, we are going to create additional tests with the objective of achieving 100% overall coverage. From examining the source code, it seems that the 0-count lines in main and copy_file are due to error-checking code that is not tested by test0000.
 | Note: This tutorial needs test0000, which was created in the previous tutorial. |
Select "Make Test" from the Test menu.
This displays the Make Test dialog box. It is easy to enter a series of tests. As is standard in CASEVision, using the Apply button in the dialog box instead of the OK button completes the task without closing the dialog box. The Test Name field supplies an incremented default test name after each test is created.
We are going to create a test set named tut_testset and add to it 8 tests in addition to test0000 from the previous tutorial. The tests test0001 and test0002 pass too few and too many arguments, respectively. test0003 attempts to copy from a file named no_file that doesn't exist. test0004 attempts to pass 0 bytes, which is illegal. test0005 attempts to copy 20 bytes from a file called not_enough, which contains only one byte. In test0006, we attempt to write to a directory without proper permission. test0007 tries to pass too many bytes. In test0008, we attempt to copy from a file without read permission.
The following steps show the command line target and arguments and description for the tests in the tutorial. The descriptions are helpful but optional. Figure 8-10 shows the features of the dialog box you'll need for creating these tests.
Enter copyn alphabet target in the CommandLine field, not enough arguments in the Description field, and click Apply (or simply press <return>) to make test0001.
Enter copyn alphabet target 20 extra_arg in the CommandLine field, too many arguments in the Description field, and click Apply to make test0002.
Enter copyn no_file target 20 in the CommandLine field, cannot access file in the Description field, and click Apply to make test0003.
Enter copyn alphabet target 0 in the Command Line field, pass bad size arg in the Description field, and click Apply to make test0004.
Enter copyn not_enough target 20 in the Command Line field, not enough data in the Description field, and click Apply to make test0005.
Enter copyn alphabet /usr/bin/target 20 in the Command Line field, cannot create target executable due to permission problems in the Description field, and click Apply to make test0006.
Enter copyn alphabet targetfile 200 in the Command Line field, size arg too big in the Description field, and click Apply to make test0007.
Enter copyn /usr/etc/snmpd.auth targetfile 20 in the Command Line field, no read permission on source file in the Description field, and click Apply to make test0008.
We now need to create the test set that will contain these tests.
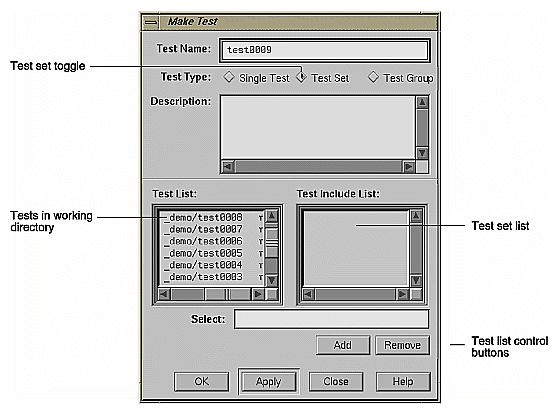
Click the Test Set toggle in the Test Type field.
This changes the dialog box as shown in Figure 8-11.
Change the default in the Test Name field to tut_testset.
This is the name of the new test set. Now we have to add the tests to the test set.
Select the first test in the Test List field and click Add.
This displays the selected test in the Test Include List field, indicating that it will be part of the test set after you click OK (or Apply and Close).
Repeat the process of selecting a test and clicking Add for each test in the Test List field. When all tests have been added to the test set, click OK.
This saves the test set as specified and closes the "Make Test" dialog box.
Enter tut_testset in the Test Name field and select "Describe Test" from the Queries menu.
This displays the test set information in the display area of the main window.
Select "Run Test" from the Test menu, enter tut_testset in the Test Name field in the "Run Test" dialog box.
This runs all the tests in the test set.
Enter tut_testset in the Test Name field in the main Tester window and select "List Summary" from the Queries menu.
This displays a summary of the results for the entire test set.
Select "List Functions" from the Queries menu.
This step serves two purposes. It enables the Source button so that we can look at counts by source line. It displays the list of functions included in the test, from which we can select functions to analyze.
Click the main function, which is displayed in the function list, and click the Source button.
This displays the source code, with the counts for each line shown in the annotations column. Note that the counts are higher now and full coverage has been achieved at the source level (although not necessarily at the assembly level).
The rest of this chapter shows you how to use the graphical user interface (GUI) to analyze test data. The GUI has all the functionality of the command line interface and in addition shows the function calls, blocks, branches, and arcs graphically.
For a discussion of applying Tester to test set optimization, refer to "Tutorial #3 — Optimizing a Test Set". To learn more about test groups, see "Tutorial #4 — Analyzing a Test Group". Although these are written for the command line interface, you can use the graphical interface to follow both tutorials.
Enter test0000 in the Test Name field of the main window and press <return>.
Since test0000 has incomplete coverage, it is more useful for illustrating how uncovered items appear.
Select "List Functions" from the Queries menu.
The list of functions displays in the text view format.
Select "Call Tree View" from the Views menu.
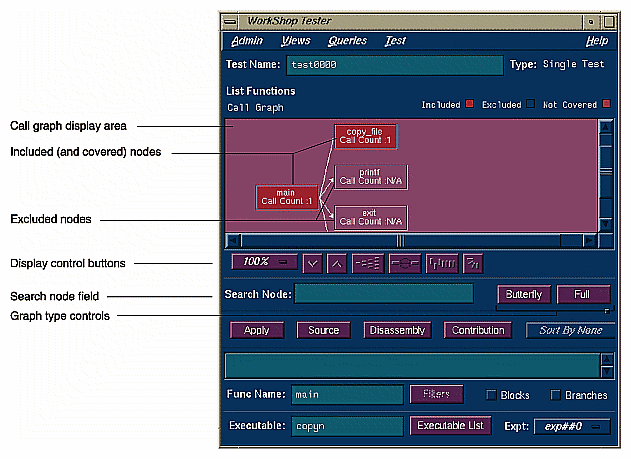
The Tester main window changes to call graph format. Figure 8-12 shows a typical call graph. Initially, the call graph displays the main function and its immediate callees.
The call graph displays functions as nodes and calls as connecting arrows. The nodes are annotated by call count information. Functions with 0 counts are highlighted. Excluded functions when visible appear in the background color.
The controls for changing the display of the call graph are just below the display area (see Figure 8-13).
Entering a function in the Search Node field scrolls the display to the portion of the graph in which the function is located.
There are two buttons controlling the type of graph. Entering a node in the Func Name field and clicking Butterfly displays the calling and called functions for that node only (Butterfly mode is the default). Selecting Full displays the entire call graph (although not all portions may be visible in the display area).
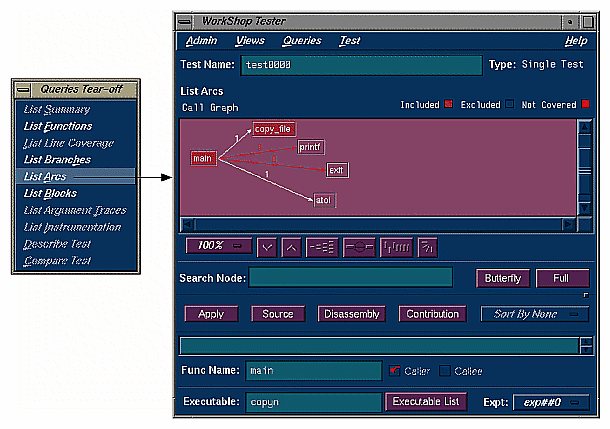
Select "List Arcs" from the Queries menu.
The "List Arcs" query displays coverage data for calls made in the test. Because we were just in call graph mode for the "List Functions" query, "List Arcs" comes up in call graph rather than text mode.
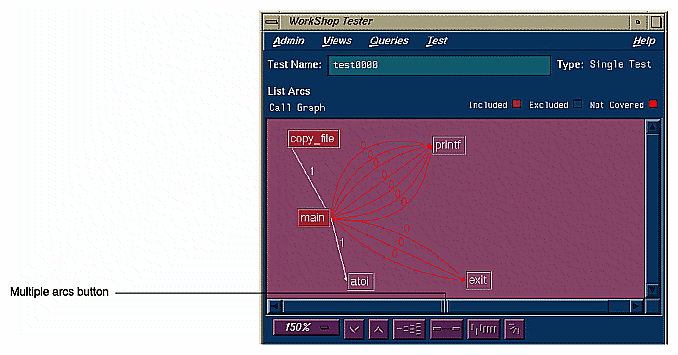
See Figure 8-14. To improve legibility, this figure has been scaled up to 150% and the nodes moved by middle-click-dragging the outlines. Arcs with 0 counts are highlighted in color. Notice that in "List Arcs", the arcs rather than the nodes are annotated.
Click the Multiple Arcs button (the third button from the right in the row of display controls).
This displays each of the potential arcs between the nodes. See Figure 8-15. Arcs labeled N/A connect excluded functions and do not have call counts.
Select "Text View" from the Views menu.
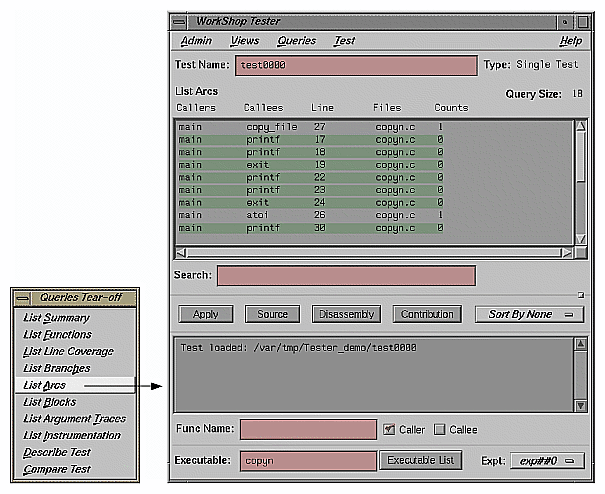
This returns the display area to text mode from call graph mode. See Figure 8-16.
The Callers column lists the calling functions. The Callees column lists the functions called. Line provides the line number where the call occurred; this is particularly useful if there are multiple arcs between the caller and callee. The Files column identifies the source code file. Counts shows the number of times the call was made.
You can sort the data in the "List Arcs" query by count, file, caller, or callee.
Select "List Blocks" from the Queries menu.
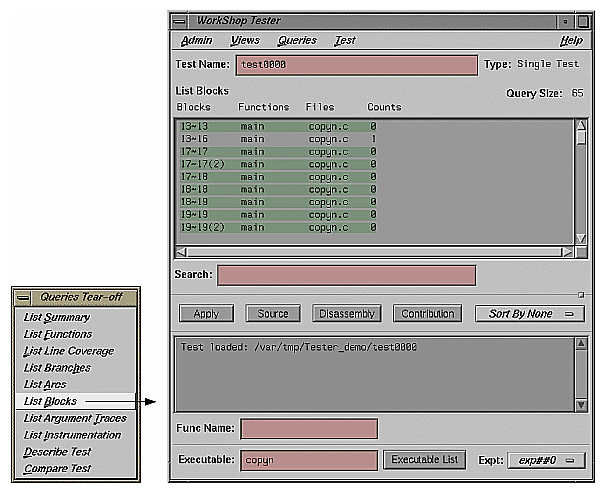
The window should be similar to Figure 8-17. The data displays in order of blocks, with the starting and ending line numbers of the block indicated. Blocks that span multiple lines are labeled sequentially in parentheses. The count for each block is shown with 0-count blocks highlighted.

Caution: Listing all blocks in a program may be very slow for large programs. To avoid this problem, limit your "List Blocks" operation to a single function.
You can sort the data for "List Blocks" by count, file, or function.
Select "List Branches" from the Queries menu.
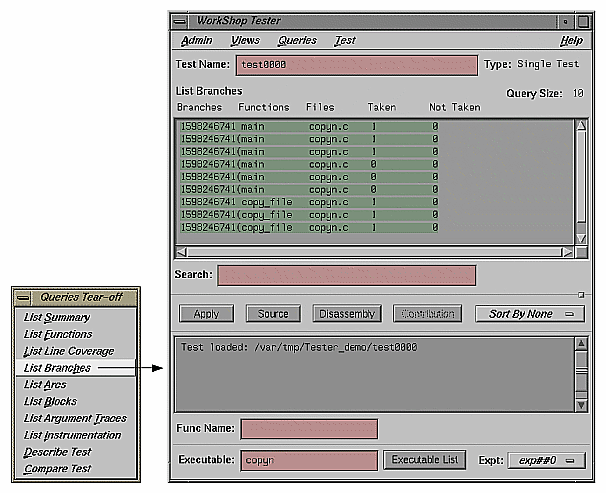
The "List Branches" query displays a window similar to Figure 8-18.
The first column shows the line number in which the branch occurs. If there are multiple branches in a line, they are labeled by order of appearance within trailing parentheses. The next two columns indicate the function containing the branch and the file. A branch is considered covered if it has been executed under both true and false conditions. The Taken column indicates the number of branches that were executed only under the true condition. The Not Taken column indicates the number of branches that were executed only under the false condition.
The "List Branches" query permits sorting by function or file.
